
Figure 5. GABA concentration- and frequency-dependent modulated synaptic transmission at retinohypothamic tract synapses by activating presynaptic GABABRs.
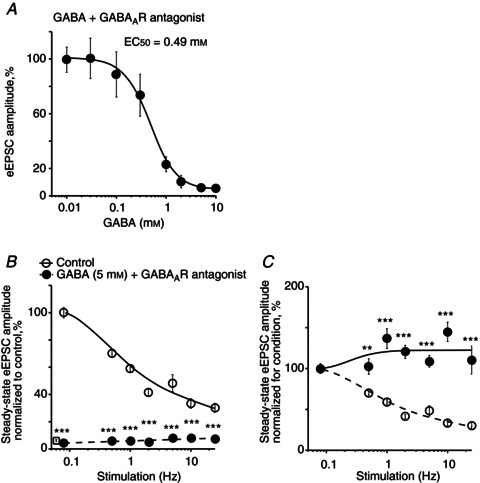
A, GABA activated presynaptic GABABRs and reduced the eEPSC amplitude in a concentration-dependent manner. GABA was applied together with the GABAAR antagonists: picrotoxin (50 μm) or bicuculline (20 μm). eEPSC amplitude (% of control) was measured during 0.08 Hz stimulation. The concentration–response curve was fitted with a Hill equation (EC50= 0.49 ± 0.04 mm, Hill coefficient = 1.86, n= 15). B, frequency dependence of the steady-state eEPSC amplitude during optic chiasm stimulation with stimulus trains (control, GABA (5 mm) together with GABAAR antagonists). Amplitude of each successive eEPSC in the stimulus train was normalized (%) to the eEPSC1 amplitude in control. The mean eEPSC1 amplitude recorded over the range of stimulus frequencies during GABA application is shown as an open square near Y-axis (5.9 ± 0.7% of control, n= 4). C, the same data normalized to the eEPSC1 amplitude for each condition (control, GABA) demonstrated short-term synaptic depression in control and, frequency-dependent relief of GABABR-mediated inhibition during GABA application. Paired t test, two tail, **P < 0.01, ***P < 0.001. eEPSC, evoked excitatory postsynaptic current.