
Figure 1. Hippocampal EEG and membrane potentials change after physostigmine (Phys) application.
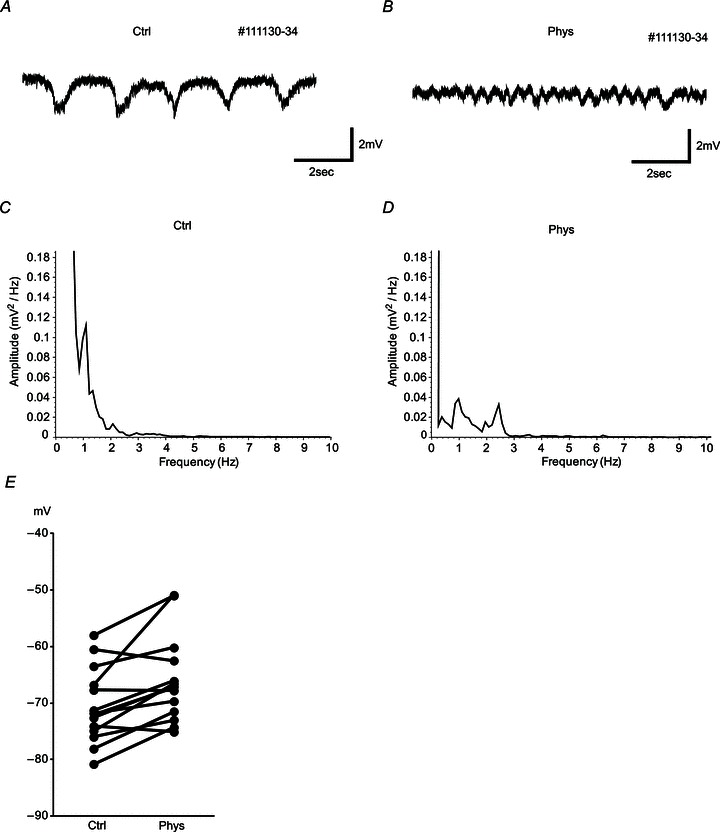
A and B, examples of hippocampal EEG are shown 30 s before (A) and 15 min after the physostigmine application intraperitoneally (B). Hippocampal EEG changed from a 0.5–1 Hz slow oscillation to a 2–4 Hz faster oscillation. C and D, power spectra of the hippocampal EEG in control condition (C) and in the presence of physostigmine (D). Relatively large power is observed in the 0.5–1 Hz band in control conditions (C) and in the 2–4 Hz band in the presence of physostigmine (D). E, averages of membrane potentials before (Ctrl) and after physostigmine application with no current injection. Ten of 14 cells showed a significant increase of membrane potentials. Averages were −70.6 (Ctrl) and −65.9 mV (Phys).