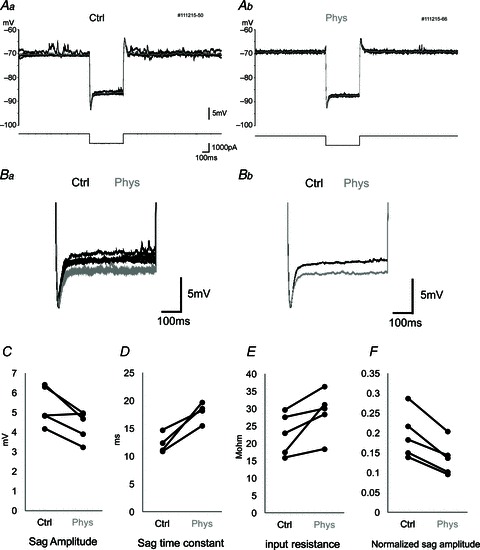
Figure 3. Sag potential amplitude and time constant during physostigmine application.

A, membrane potential response (upper traces) to current square pulse (−1000 pA) stimulation (lower traces) in control conditions (Aa) and after physostigmine application (Ab). A large sag potential is observed immediately after the initiation of the current pulse. Five traces are overlaid, and the grey trace is the average. B, higher magnification of sag potentials. Five raw traces (Ba) and averaged traces (Bb) are overlaid in control conditions (black) and after physostigmine application (grey). Traces were aligned with the trough immediately after the onset of negative current stimulation. C–F, averaged values of sag amplitude (C), sag time constant (D), input resistance (E) and normalized sag amplitude (F) in individual neurons in control conditions (Ctrl) and in the presence of physostigmine (Phys). Each connected pair indicates the data from a single cell. The normalized sag amplitude (F) is calculated as sag amplitude divided by the amplitude of the initial negative potential immediately after the negative current pulse to cancel out the effect of input resistance change on sag amplitude. There is a significant increase in the sag time constant during physostigmine application.
