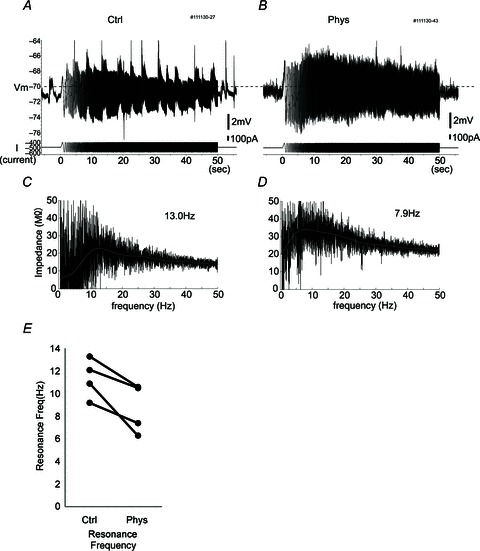
Figure 4. Resonance frequency becomes lower after physostigmine application.

A and B, raw traces of the response to frequency sweep (chirp) stimulation in control conditions (A) and in the presence of physostigmine (B). Top traces are membrane potential; bottom traces are injected current. Chirp stimulation consists of a sine wave that increases in frequency from 0 to 50 Hz linearly over 50 s. The dashed line indicates −70 mV. C and D, impedance profile in each frequency calculated by the response amplitude (A and B) of chirp stimulation in control conditions (C) and in the presence of physostigmine (D). Grey trace indicates the fitted trace using a 10th-order polynomial. Note that the resonance (peak) frequency shifted from 13.0 to 7.9 Hz after physostigmine administration. E, averaged values of resonance frequencies in individual neurons (n= 4, P < 0.05).
