
Figure 7. Most neurons show a steeper slope of the f–I curve during ramp stimulation after physostigmine application.
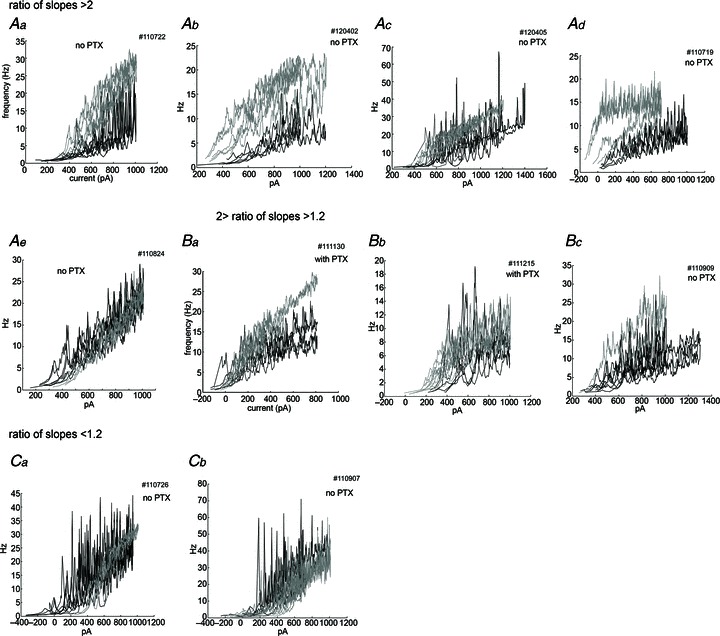
Control traces (black) and physostigmine traces (grey) are overlaid for each cell. These data are aligned by the ratio of the averaged initial up-ramp slope in the presence of physostigmine to that in the control conditions. The ratio was larger than 2.0 in 5 neurons (Aa–e), between 1.2 and 2.0 in 3 neurons (Ba–c), and less than 1.2 in 2 neurons (Ca–b). Note that Ad and Bc showed clear hysteresis in the presence of physostigmine. Traces were smoothed by averaging 10 interspike intervals.