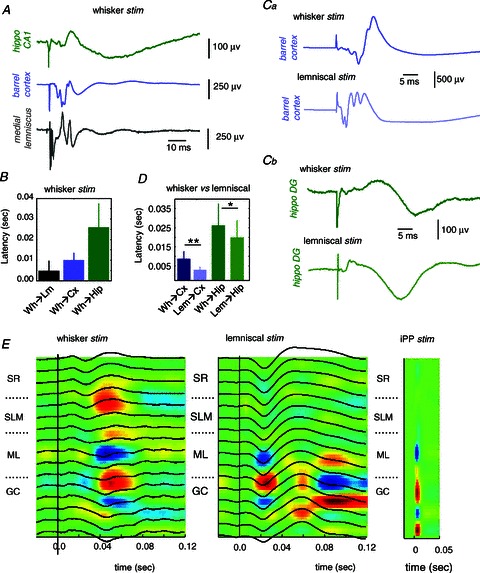
Figure 2. Comparison between whisker and lemniscal stimulation.

A, representative example of field potential responses to whisker pad stimulation at different steps of the somatosensory pathway and the hippocampus. B, average latency response to whisker pad stimulation (Wh) as recorded in the medial lemniscus (Lm, n= 14 stimulation sessions), S1 barrel cortex (Cx, n= 9) and the hippocampus (Hip, n= 9). Ca and b, comparison between whisker and lemniscal stimulation in the same animal while recording in the barrel cortex (Ca) and the hippocampal DG region (Cb). D, average latency of the response peak in the barrel cortex (n= 6 sessions) and the hippocampus (n= 9 sessions) to whisker and lemniscal stimulation. *P < 0.05; **P < 0.01. E, local field potential (black traces) and CSD responses (underlying colour map) to whisker pad (left), lemniscal (middle) and ipsilateral perforant path (iPP, right) stimulation. Data from 16-channel probes at 50 μm spacing. Sinks are blue; sources are red. Note correspondence between sinks recorded at the molecular layer (ML) for all stimulation sites. SR, stratum radiatum; SLM, stratum lacunosum moleculare; GC, granule cell layer.
