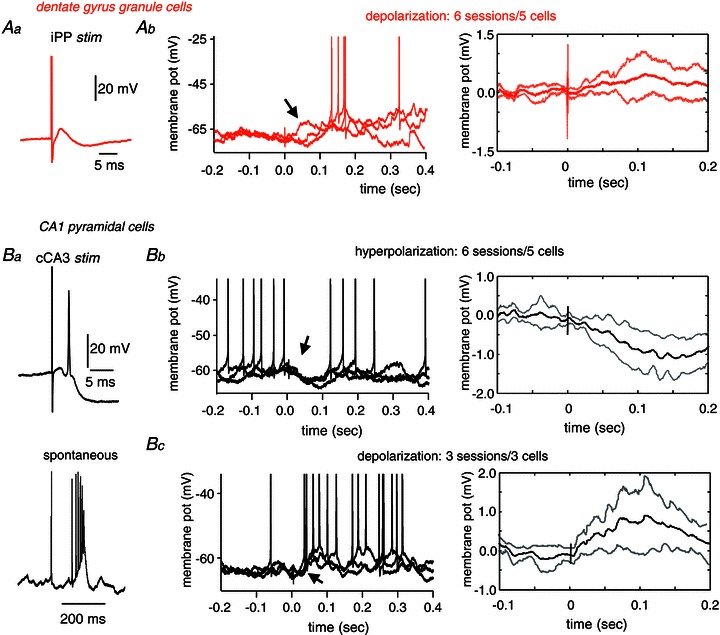
Figure 6. Intracellular responses to somatosensory stimulation.

Aa, granule cells intracellularly recorded in the dentate gyrus were tested with stimulation of the ipsilateral perforant pathway (iPP). Ab, left, example of three individual traces of a representative granule cell showing depolarizing responses to somatosensory stimulation (hindpaw). Spikes are truncated to highlight changes of membrane potentials. Arrow points to the early membrane depolarizing response. Ab, right, grand average of the mean membrane potential response from n= 6 sessions from 5 granule cells showing depolarizing responses. Ba, CA1 pyramidal cells were characterized by their response to the stimulation of the contralateral CA3 (cCA3) (upper panel) and their typical spontaneous firing pattern consisting of complex-spike bursts (lower panel). Bb, left, example of three individual traces of a typical CA1 pyramidal cell showing hyperpolarizing responses to hindpaw stimulation. Spikes are truncated. Note membrane potential hyperpolarization resulting in firing suppression (arrow). Bb, right, grand average of the mean membrane potential response from n= 6 sessions from 5 CA1 pyramidal cells. Bc, left, example of three individual traces of the intracellular response of the complex-spike cell shown at B1 that responded with depolarization to hindpaw stimulation. Spikes are truncated to highlight membrane changes (arrow). Bc, right, grand average of the mean membrane potential response from n= 3 sessions from 3 CA1 pyramidal cells that exhibited depolarizing responses.
