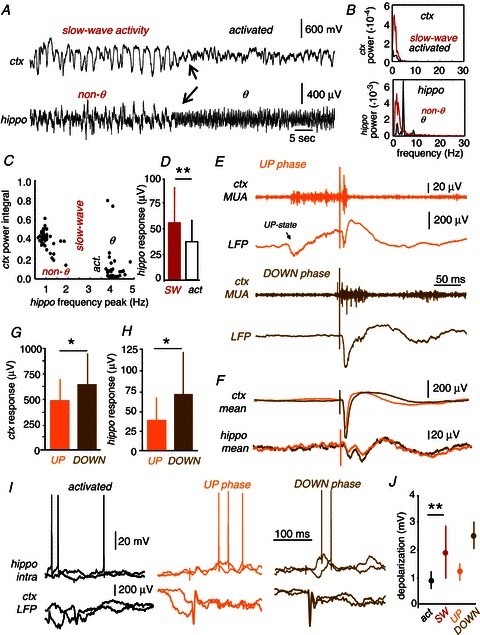
Figure 8. Cortical modulation of hippocampal responses to somatosensory stimulation.

A, simultaneous recordings of hippocampal (granular layer of the dentate gyrus) and cortical (primary somatosensory cortex) activity permitted us to investigate the joint state dynamics and their influence in hippocampal responses. Cortical states were classified as slow-wave activity or activated state. The hippocampal state was classified as theta or non-theta. Arrows point to the state transition in both the cortex and the hippocampus. B, power spectral analysis of the cortical and hippocampal signals shown in A during the different states. C, example of the joint state dynamics of hippocampal and cortical activity. Clusters of similar dynamical states were typically formed. D, hippocampal local field potential (LFP) responses obtained during episodes of cortical slow-wave activity (SW) were significantly larger than those obtained during the activated state (**paired t test, P= 0.0060). E, individual somatosensory stimuli can arrive at different phases of slow-wave activity. Stimuli can either arrive during a cortical up state (UP phase, orange) or during a down state (DOWN phase, brown). F, both the cortical and the hippocampal response were smaller for those stimuli arriving during the UP than during the DOWN phase. G, LFP cortical averaged response was smaller when the stimuli occurred during the UP compared to DOWN phases of SW activity (**paired t test: P < 0.0001). H, the LFP hippocampal averaged response was smaller during UP compared to DOWN phases of cortical SW activity (*paired t test: P= 0.0195). I, intracellular responses recorded in a representative granule cell during the activated (black) and the UP (orange) and DOWN (brown) phases of cortical slow-wave activity. LFP activity in the primary somatosensory cortex was recorded simultaneously. J, mean depolarizing responses recorded in granule cells as a function of the distant cortical state grouped as activated (act., black) and slow-wave (SW, red). Data from 6 sessions from 4 cells. **P= 0.0079. Dependence of mean depolarizing responses with the UP–DOWN phase is also shown. Data from 2 sessions from 2 granule cells.
