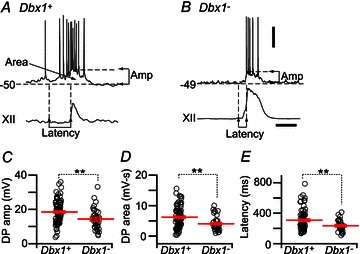
Figure 2. Properties of Dbx1+ and Dbx1− neurons measured in the context of respiratory rhythm.

A and B, top traces, single inspiratory burst in a Dbx1+ (A) and a Dbx1− neuron (B) and the corresponding XII output (bottom traces). Horizontal dashed lines indicate the baseline membrane potential and the amplitude of the depolarization envelope in the burst. Vertical dashed lines indicate: (1) the onset of subthreshold pre-inspiratory depolarization; and (2) the onsets of the inspiratory burst and the XII output. The time interval denotes latency. C–E, individual measurements (open circles) of drive potential (DP) amplitude (C), drive potential area (D) and latency (E) of Dbx1+ (n= 82 for drive potential amplitude and area, n= 70 for latency) and Dbx1− neurons (n= 33 for drive potential amplitude and area, n= 28 for latency). Long red horizontal lines show mean values. Short red lines display SEM. **P < 0.01 (two-way repeated measures ANOVA). Voltage (20 mV) and time (0.5 s) scale bars apply to traces in A and B.
