
Figure 6. Delayed excitation and ‘sag’ potentials in Dbx1+ (A and B) and Dbx1− neurons (C).
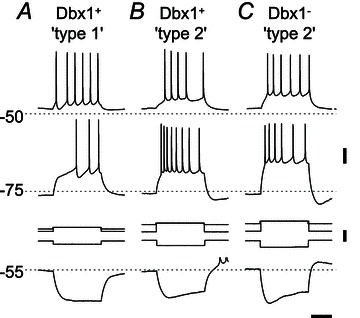
Depolarizing pulses (500 ms) were injected from a depolarized potential (above −50 mV) and from a hyperpolarized potential of −75 mV. Hyperpolarizing pulses were injected from −55 mV. A, a type 1 Dbx1+ neuron exhibiting delayed excitation from −75 mV, but not from −50 mV, and no sag potential in response to the hyperpolarizing pulse. B and C, a type 2 Dbx1+ (B) and a Dbx1− neuron (C) exhibiting sag potentials but no delayed excitation. Spikes are truncated above −50 mV in B (bottom trace). Voltage (20 mV), current (0.2 nA) and time (0.2 s) scale bars apply to all traces.