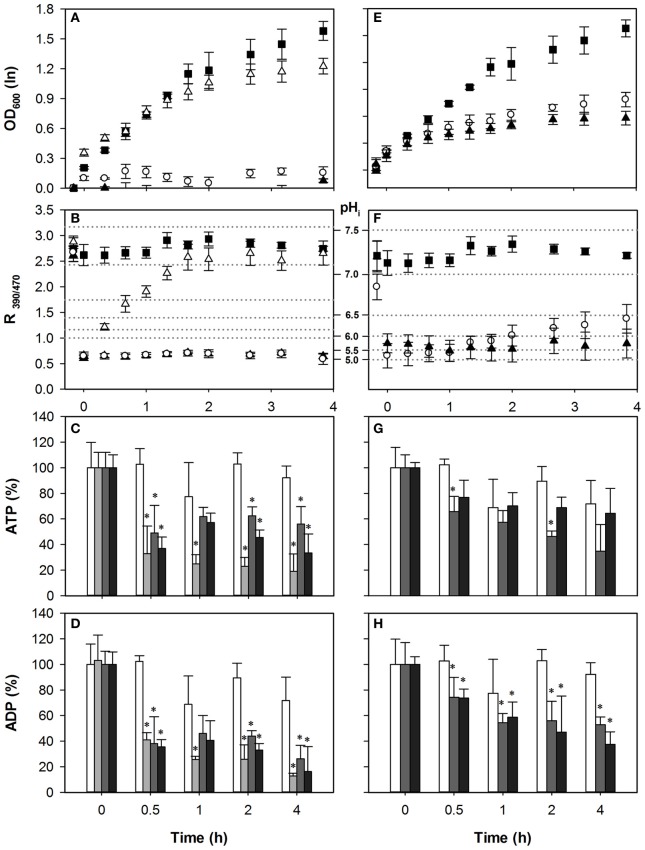
Figure 3.
Effect of acetic acid (left hand panels) and sorbic acid (right hand panels) on growth (A,E), intracellular pH (B,F), cellular ATP (C,G), and ADP (D,H) concentrations of pma1-007. Growing cultures were exposed to 0 mM (■ and white bars), 25 mM (△ and light gray bars), 40 mM HA or 1 mM HS (◦ and dark gray bars), and 70 mM HA or 2 mM HS (▲ and black bars) of HA/HS at t = 0. pHi data are presented as ratio of fluorescence emission upon excitation at 390 nm and 470 nm (R390/470) while the relevant pHi values derived from the calibration curves are also indicated. Data presented are the average of three independent cultivations and error bars represents standard deviation. An asterisk indicates significance of the difference between acid exposed and control cultures at similar time point (two-tailed t-test; P < 0.05). 40 mM HA or 1 mM HS.

