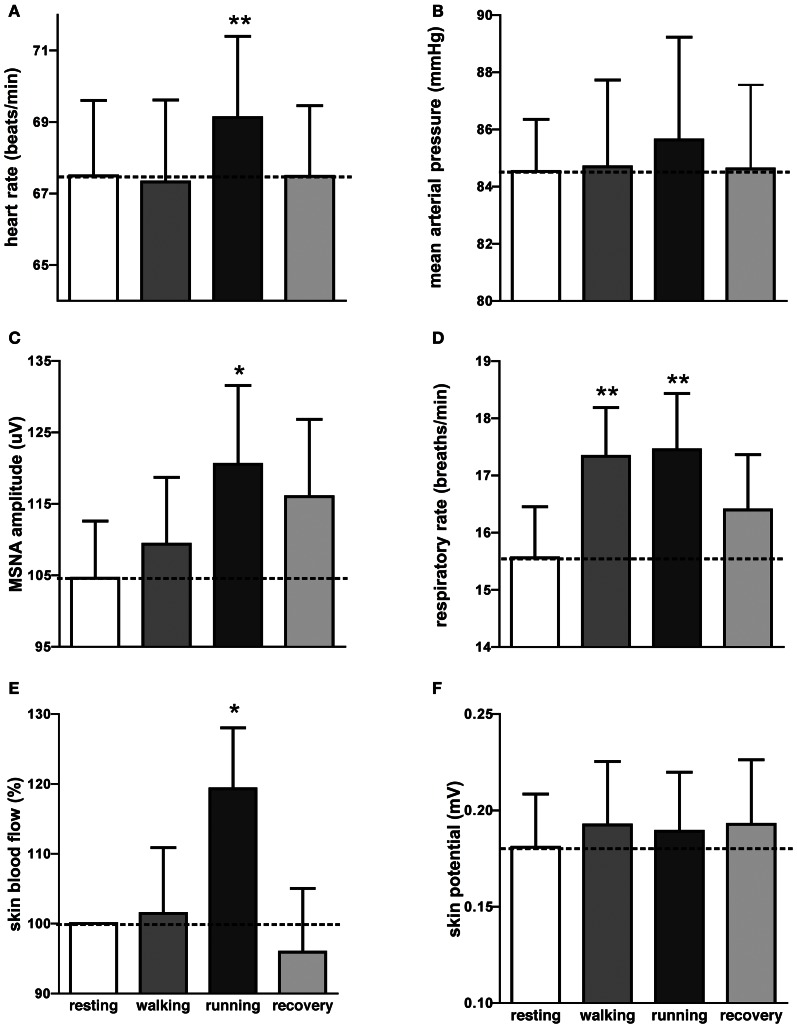
Figure 2.
Mean (±SE) values of heart rate (A), mean arterial pressure (B), MSNA burst amplitude (C), respiratory rate (D), skin blood flow (E), and sweat release (F) at rest, during passive viewing of first-person walking, running, and recovery. Skin blood flow was normalized to the resting value. *p < 0.05, **p < 0.01.

