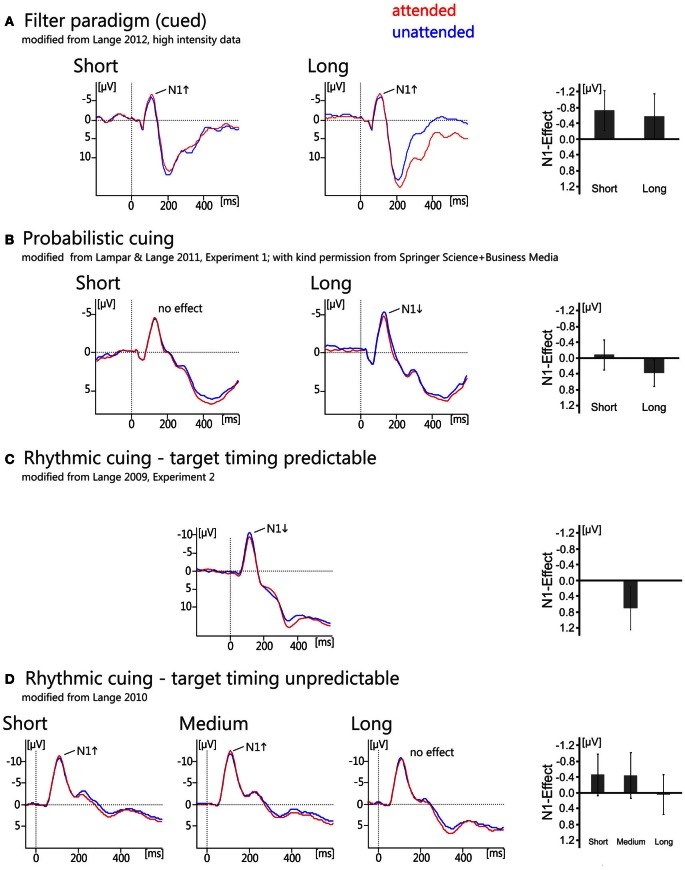
Figure 2.
Overview of grand average ERP waveforms (left) and bar graphs of the effects (right) showing the N1-effects of temporal orienting as measured in temporal filter tasks (A), temporal probabilistic cuing (B), and rhythmic cuing with and without predictability of target timing (C,D). For the filter task (A) and probabilistic cuing (B), ERPs are shown for electrode Cz and C3, respectively, separately for the short and the long interval. Traces are aligned to a post-stimulus baseline from 0 to 50 ms. For the rhythmic cuing task with predictable target timing, the effect is depicted at electrode Cz and traces are aligned to a 200 ms pre-stimulus baseline. For the rhythmic cuing task with unpredictable target timing, the effect is depicted at a left electrode cluster consisting of electrodes Fz, Cz, and Pz, and traces are aligned to a 0–50 ms post-stimulus baseline. Bar graphs show the attention effects (ERPattended minus ERPunattended), with error bars representing the 95% confidence limen.

