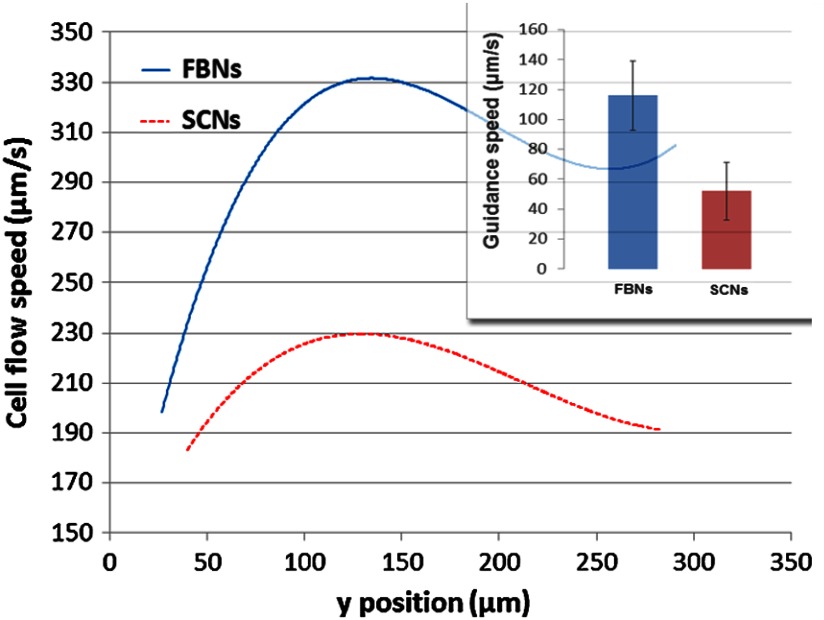
Fig. 3.
Cell-flow speeds in the laser-guidance region: each cubic-polynomial-fitting curve averages the speed traces of 10 cells [blue for forebrain neurons (FBNs) and red for spinal cord neurons (SCNs)] along the -direction. The bar graph shows the significant difference in guidance speed of the two cell types.

