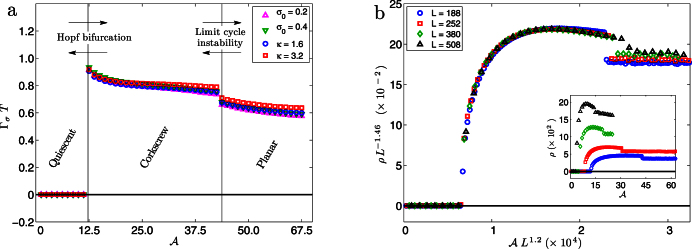
Figure 4. Variation of the scaled timeperiod ΓσT of filament beating with  plotted for various values of κ and σ0 with L = 188, and (b, main panel) variation of the scaled amplitude L–1.46ρ with
  plotted for various lengths L with κ = 1.6.

In (a) we show the appearance of spontaneous oscillations in the filament at  corresponding to rigid corkscrew rotation, followed by a transition at
  to flexible planar beating. In (b, inset) we show the increase in the unscaled amplitude with length.
