Figure 1.
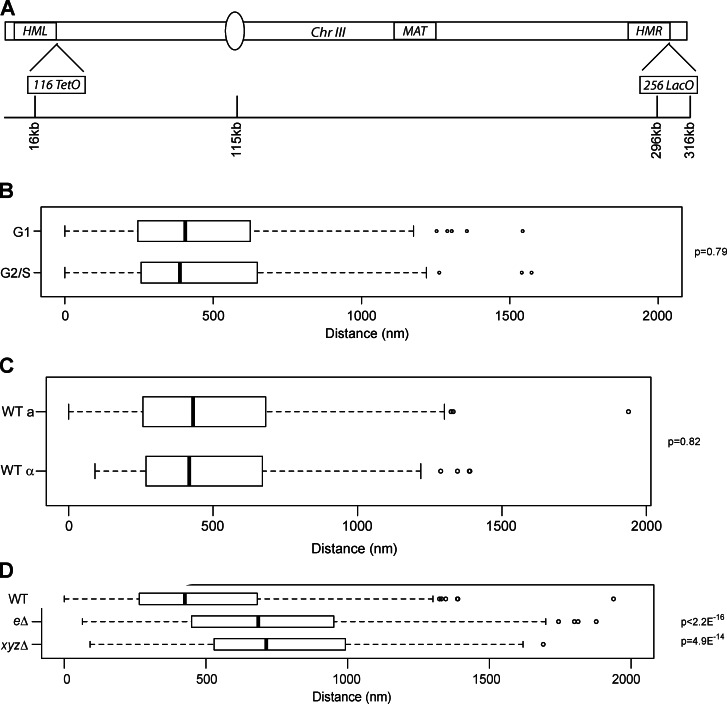
HML and HMR are in close three-dimensional proximity. (A) Schematic of budding yeast chromosome III with locations of TetO and LacO arrays. (B–D) Boxplots of the distance between TetR-YFP and CFP-LacI foci in asynchronously growing cells in G1 (n = 192) or G2/S (n = 136; B) in MATa (n = 153) and MATα cells (n = 152; C) and in an hmr-eΔ strain (n = 353) and an xyzΔ strain (n = 202; D). P-values were calculated using a Mann-Whitney U test (Wilcoxon test). Data are from all cells counted from at least two independent trials (see Materials and methods). The boxes represent the middle 50% of data points with the black lines showing the median of distances. Outliers are defined as distances >1.5 times the interquartile range (dashed lines) and are represented by open circles.

