Figure 2.
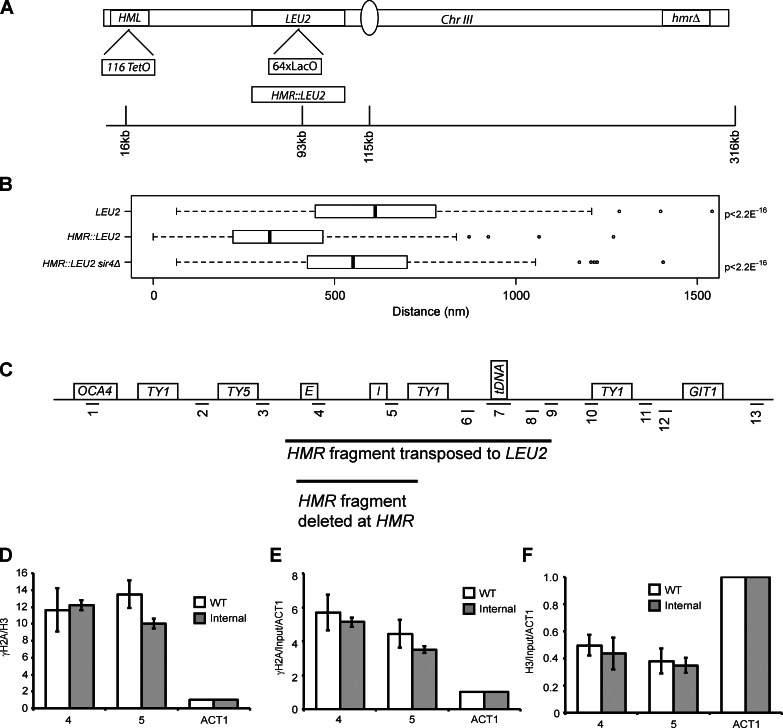
Role of telomeres in HML and HMR proximity. (A) Schematic of chromosome III constructs for internal HMR analysis. A 64× LacO array integrated at the LEU2 gene with or without a 3.3-kb fragment of HMR, a 128× TetO array at HML, and an hmrΔ at its native locus. (B) Boxplots of the distance between TetR-YFP and CFP-LacI foci in a given strain: LEU2 (n = 228), HMR::LEU2 (n = 274), and HMR::LEU2 sir4Δ (n = 209). The boxes represent the middle 50% of data points with the black lines showing the median of distances. Outliers are defined as distances >1.5 times the interquartile range (dashed lines) and are represented by open circles. (C) A schematic of the HMR locus. (D–F) ChIP of ratio γ-H2A/H3 (D), γ-H2A (E), and H3 (F) compared with the native locus (Fig. 6 C). Error bars represent standard deviation from the mean for n = 6 (WT) and n = 4 (internal).

