Figure 6.
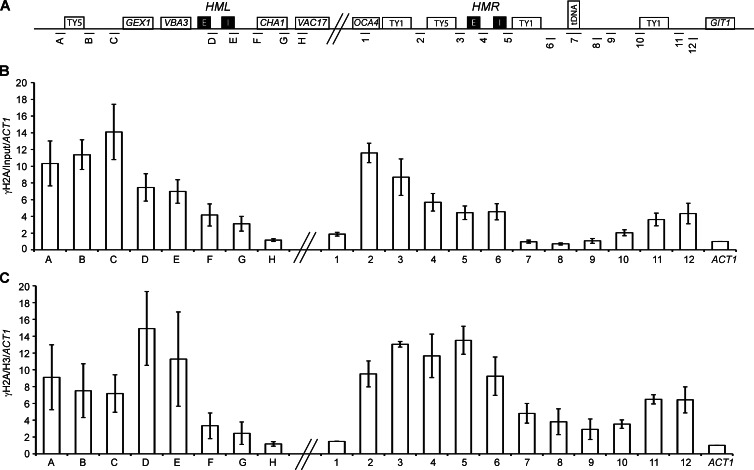
γ-H2A is enriched at HM loci and their surrounding chromosomal regions. (A) Schematic of the HML and HMR loci on chromosome III with amplicons used in ChIP-qPCR. Schematic is not to scale. (B) ChIP mapping of γ-H2A. Data are presented as the mean enrichment of IP/input further normalized to an ACT1 amplicon for six IPs from three independent cross-links. Error bars are standard deviation from the mean. (C) γ-H2A enrichment normalized to H3 enrichment to consider nucleosome occupancy. All amplicons normalized to the ACT1 locus.

