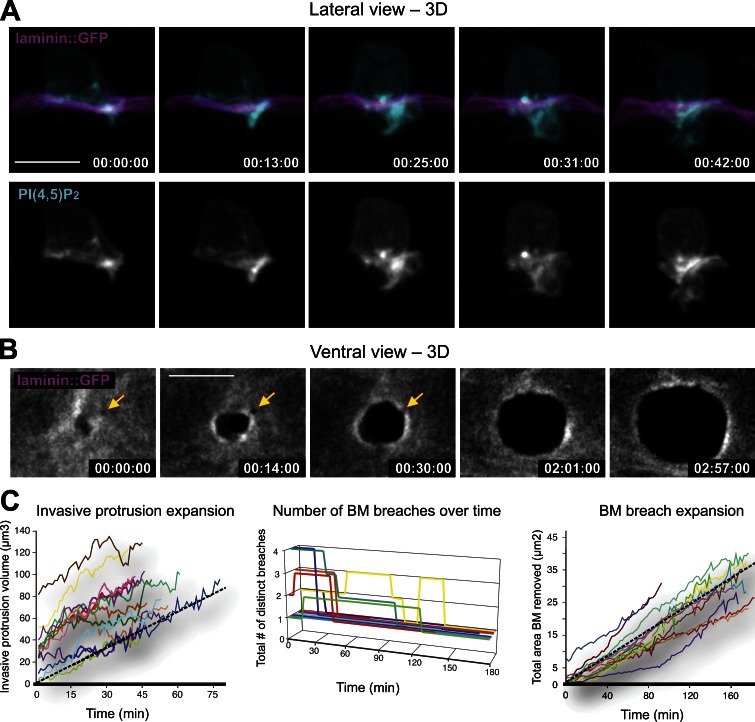
Figure 2.
Invadopodia give rise to an invasive protrusion that removes basement membrane. (A) A lateral view time series shows the growth of the invasive membrane protrusion (viewed with the AC-specific PI(4,5)P2 probe cdh-3 > mCherry::PLCδPH in cyan [top; grayscale, bottom]) as it advances through the basement membrane (viewed with laminin::GFP in magenta [top]) and into the vulval epithelium. (B) A ventral view time series shows the expanding hole in the basement membrane that forms during AC invasion. The yellow arrows indicate a second breach that is overcome by the expanding basement membrane gap opening where the invasive protrusion is growing. Bars, 5 µm. (C) The graphs display the growth rate of the invasive protrusion (left) and dynamics of basement membrane gap formation (middle and right). Black dotted lines represent the mean rate of invasive protrusion expansion (1.08 ± 0.42 µm3/min [±SD], mean r2 = 0.83, n = 13) and basement membrane hole expansion (0.20 ± 0.06 µm2/min [±SD], mean r2 = 0.97, n = 13).

