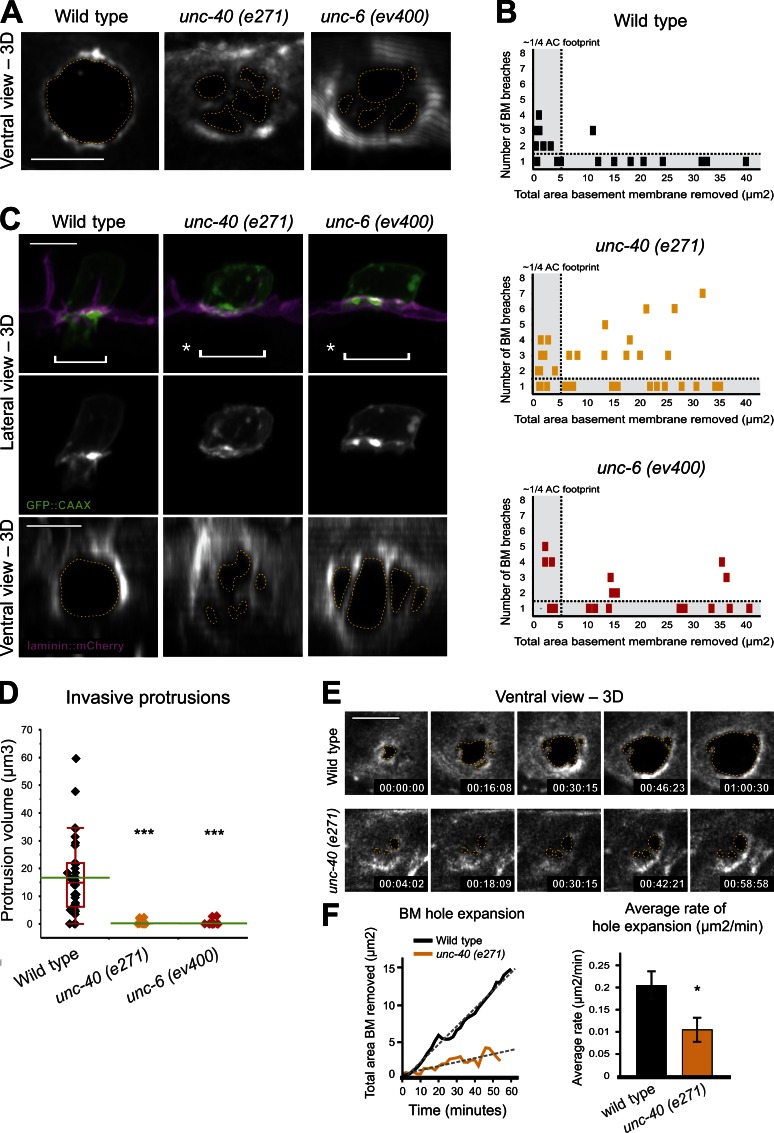
Figure 4.
UNC-40 and UNC-6 promote invasive protrusion formation and basement membrane clearance. (A) A single basement membrane gap (basement membrane viewed with laminin::GFP) is formed in wild-type animals (left, outlined by dotted line), whereas in unc-40 and unc-6 mutants multiple basement membrane breaches occur (middle and right). (B) Quantification of basement membrane breaching (each block represents one animal) reveals that when multiple basement membrane breaching events occur in wild-type animals, they quickly resolve into a single gap (top). In contrast, when multiple breaches occur in unc-40 and unc-6 mutants they often fail to resolve into a single basement membrane hole (middle and bottom). (C) Examination of ACs expressing the cell membrane marker cdh-3 > GFP::CAAX (top, green; middle, grayscale) reveals the presence of an invasive protrusion (bracket) that extends across the basement membrane (top left, magenta) through a single basement membrane gap in a wild-type animal (bottom left, ventral view, grayscale). In unc-40 (middle) and unc-6 (right) mutants no invasive protrusion is extended (asterisks with brackets) through the multiple basement membrane gaps (bottom). (D) Quantification of the volume of the invasive protrusion formed within an hour of initial basement membrane breach in wild-type, unc-6, and unc-40 mutant animals (n ≥ 28 animals examined for each genotype). The asterisks denote statistically significant differences (P < 0.0001, Wilcoxon rank-sum test). (E) A ventral view time series of the basement membrane (visualized with laminin::GFP) in a wild-type animal (top) captures the faster rate of basement membrane opening compared with an unc-40 mutant (bottom; see Video 6). (F) The graphs show quantification of basement membrane removal over time for the animals shown in E (left) and the mean rates of hole expansion for wild-type and unc-40(e271) animals (right). Asterisk denotes a statistically significant difference (P = 0.01, Student’s t test; n = 6 animals per genotype). Error bar represents SEM. Bars, 5 µm.

