Figure 5.
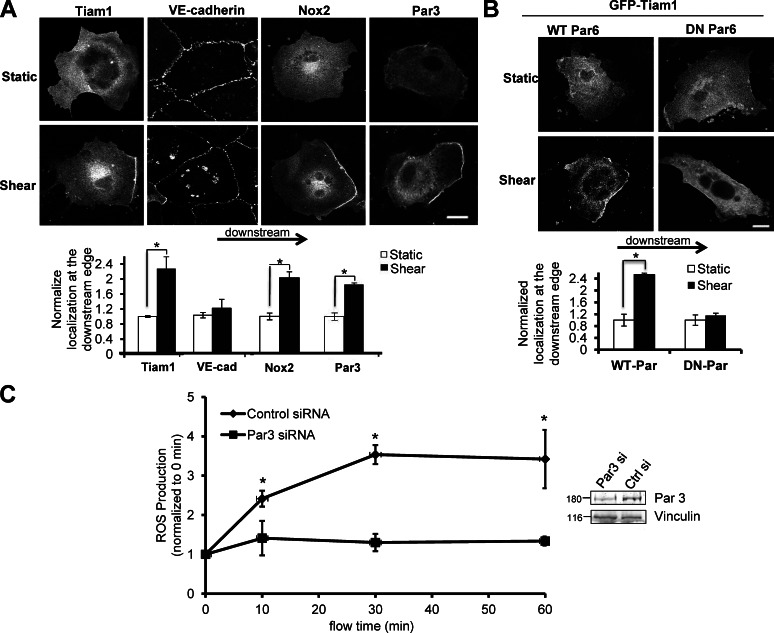
Tiam1, Nox2, and Par3 polarize in response to shear stress. (A) ECs were transfected with myc-tagged Par3, GFP-Tiam1, or myc-Nox2. 48 h after transfection, shear stress was applied or cells were left as static controls. Cells were immediately fixed and immunostained with anti–VE-cadherin or anti-myc antibodies. Total fluorescence intensity was measured at the upstream and downstream regions of the cell. The ratio of downstream fluorescence to upstream fluorescence for each cell was calculated, and sheared values were normalized to static controls. n = 3 and >60 cells per condition were analyzed. Bar, 10 µm. (B) BAECs were cotransfected with WT-Par6 or DN-Par6 and wild-type GFP-Tiam1. 48 h after transfection, shear stress was applied or cells were left as static controls. Total fluorescence intensity was measured at the upstream and downstream regions of the cell. The ratio of downstream fluorescence to upstream fluorescence for each cell was calculated, and sheared values were normalized to static controls. n = 3 and >15 cells per condition were analyzed. Bar, 10 µm. (C) ECs were transfected with control or Par3-specific siRNAs. 72 h after transfection, cells were incubated with the H2-DCFDA dye and sheared for indicated times. Shear stress was subsequently applied in continued presence of the H2-DCFDA dye for the indicated times. ROS production was assessed by measuring the fluorescence of the cell lysates at excitation 485 nm/emission 535 nm. Bar graph is representative of three independent experiments. For all panels, values are mean ± SEM; *, P < 0.05.

