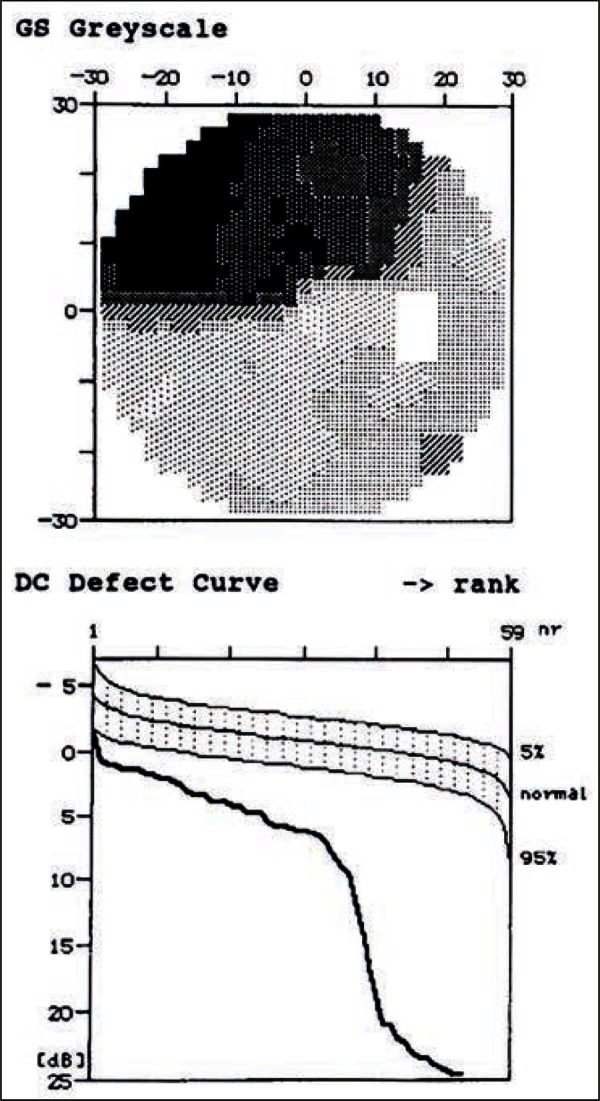
Figure 11.

This cumulative defect curve shows both generalised depression of the field values, as well as a large deep localised defect (seen in the grey scale). It doesn't however signify the type of the defect.

This cumulative defect curve shows both generalised depression of the field values, as well as a large deep localised defect (seen in the grey scale). It doesn't however signify the type of the defect.