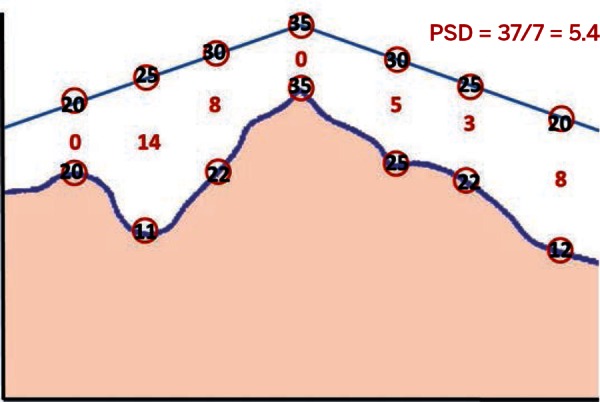
Figure 9a.

The pattern standard deviation (PSD) is the difference between the expected data (the straight line at the top) and the patient's own data (the irregular line beneath it). Here, the sum of the differences is 38, which, when divided by number of test locations, yields 5.4. This reflects an irregular hill of vision.
