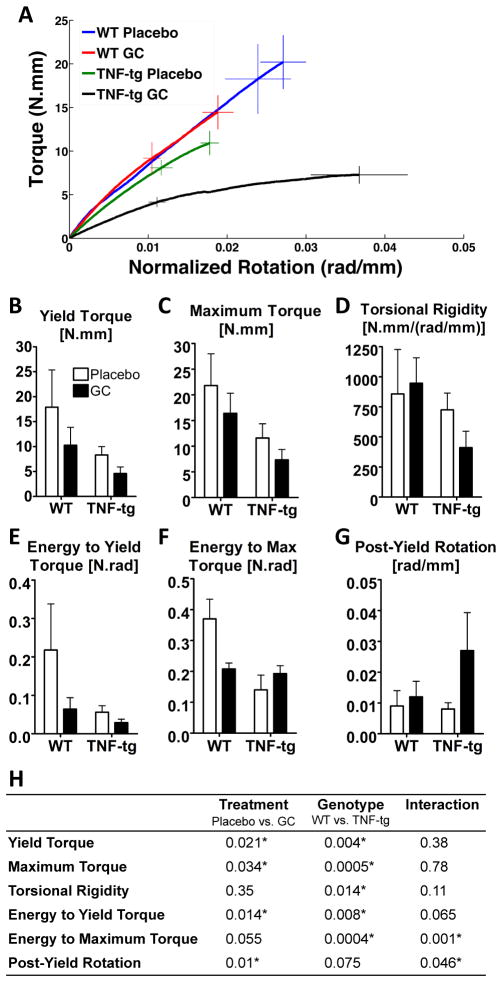
Figure 1. Biomechanical properties of tibial diaphysis under torsional loading.
A: Averaged torque-rotation curves of each experimental group at 42 days post-treatment. Error bars represent the standard error of the mean torques (vertical bars) and rotations (horizontal bars) at the maximum loading point (solid bars) and yield point (dashed bars). B–G: Biomechanical parameters of tibiae derived from torsional testing after 42 days of treatment. Bars represent group means and error bars represent the standard deviation (n=4 per group). H: Summary of p-values from two-way ANOVA tests of the biomechanical parameters at 42 days of treatment. Statistical significance was defined as p < 0.05.

