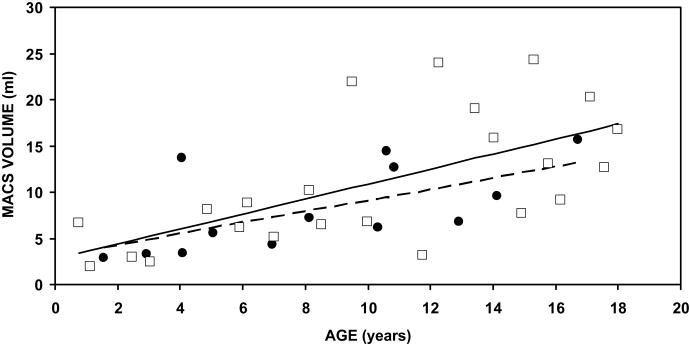
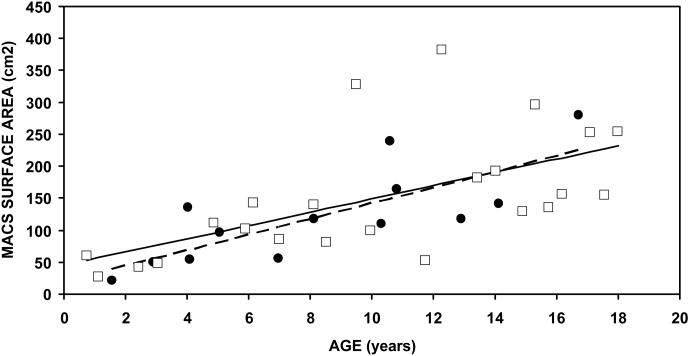
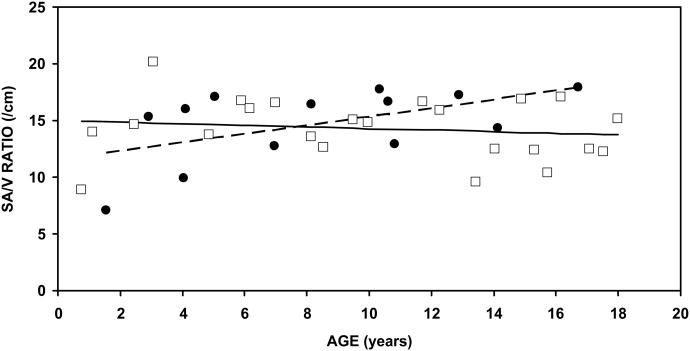
Figure 2.
Average left and right Volume (A), Surface Area (B) and the SA/V Ratio for each individual as a function of Age. Closed circles denote the MACS for female subjects and open squares denote the MACS for male subjects. The broken line is the solution of the regression equation for the data of female subjects and the solid line is the solution of the regression equation for the data of male subjects.


