
Figure 3.
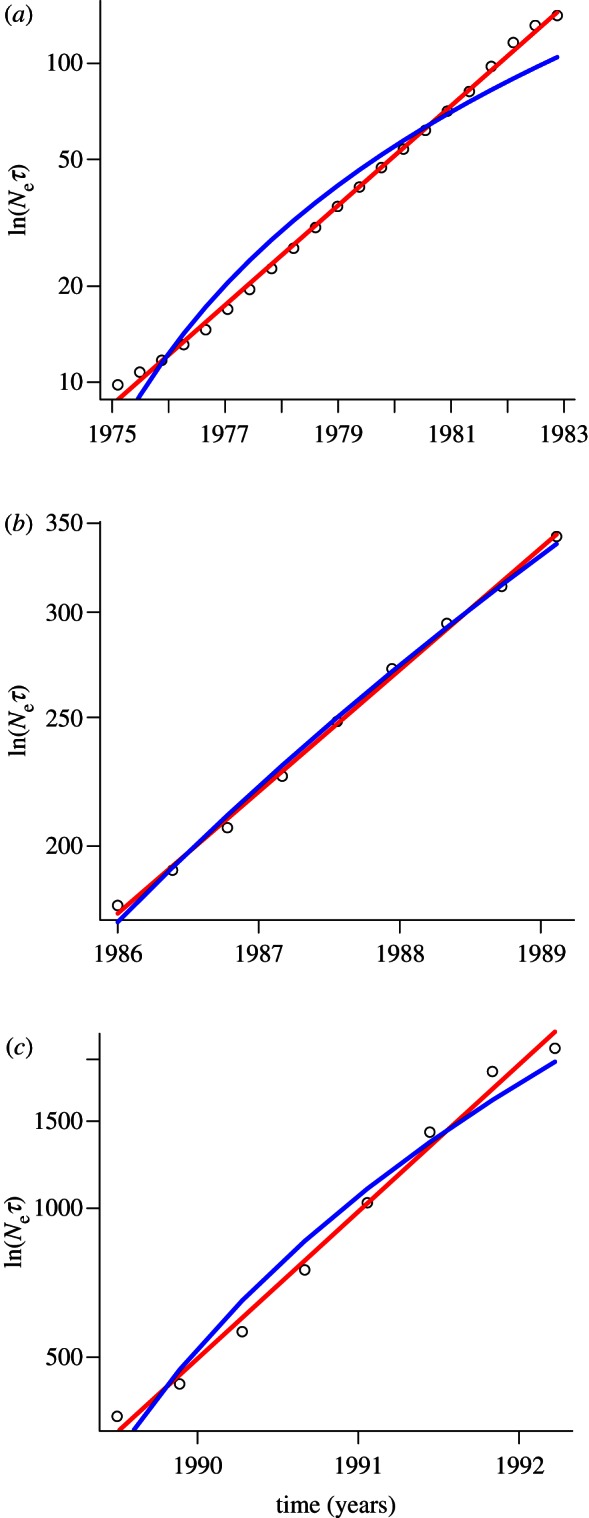
Growth in the effective number of infections (Neτ) during the three phases of the mid-Atlantic raccoon rabies epidemic [34]. In each panel the circles show the growth in Neτ obtained from a Bayesian skyline plot analysis of 44 rabies sequences [34], the red line shows the fit of an exponential growth model and the blue line shows a time-squared model of growth. For each phase of the epidemic the exponential model of growth is a better fit ((a) ΔAIC = −65.2; (b) ΔAIC = −6.6; (c) ΔAIC = −9.6), suggesting that long-distance translocation facilitated the spread of rabies in the mid-Atlantic epidemic.