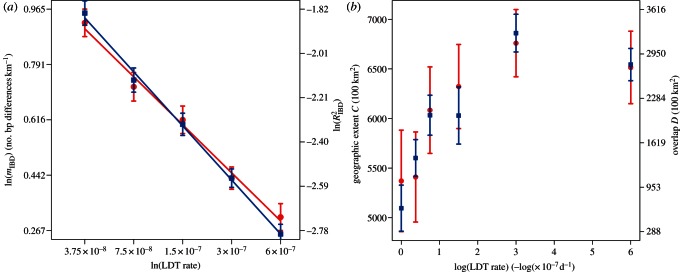
Figure 4.
Indicators of spatial structure created by different rates of LDT. (a) Change in the strength of IBD at different rates of LDT. When there is long-distance dispersal between locations (ϕLDT ≠ 0) the slope (red) and correlation coefficient (blue) both decrease directly as the log of the LDT rate increases. Regression lines were fitted to the data from individual replicates (mIBD =−0.298 ln(ϕLDT) + 0.57, p = 0.012; RIBD2 =−0.03 ln(ϕLDT) – 0.232, p = 2.55×10⁻¹⁰). (b) The area of genetic groups (red) and the area of overlap between groups (blue) at six rates of LDT. Points are means and the bars show the standard error of the mean for the replicates at each rate of LDT.

