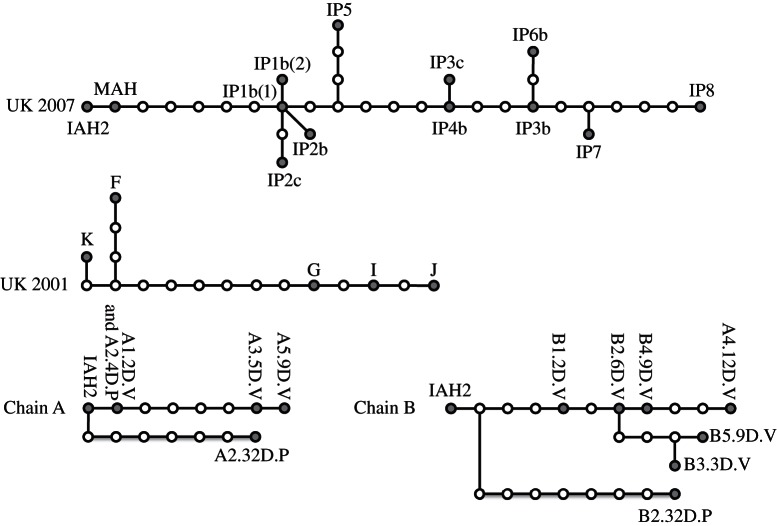
Figure 4.
Statistical parsimony trees of FMD transmission between cows and herds: UK2007 and UK2001 represent the between-herd transmission tree from the full 2007 FMD epidemic [12] and the largest chain from the 2001 epidemic [11], respectively. Chain A and Chain B represent two between cow transmission chains from the study of Juleff et al. [38]. In all cases, solid black circles represent samples from different cows or herds, open circles represent unsampled genomes and the connecting lines represent single nucleotide differences between genomes.

