
Figure 6.
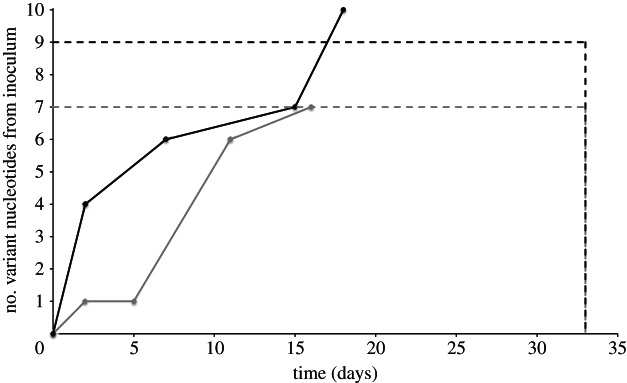
Comparison of within and between nucleotide variations. The solid grey and black lines represent the accumulated number of variant nucleotides over time between consensus sequences along the A1 → A5 and B1 → B5 chains (figure 5), respectively. The dashed grey (A chain) and black (B chain) lines represent the number of variant nucleotides observed in animal number 2 of the chain in the sample taken 32 DPFC.