Figure 3.
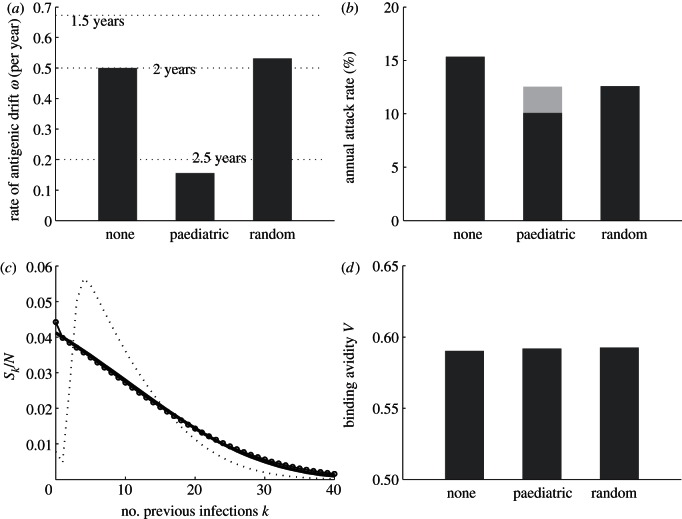
The effect of vaccination strategies on the rate of antigenic drift and disease incidence. (a) The equilibrium rate of antigenic drift under no vaccination, paediatric vaccination and random vaccination strategies. Horizontal lines with years marked correspond to 1/ω, the average duration of immunity. (b) The annual attack rate for influenza under these three strategies. The grey bar shows the annual attack rate under the paediatric vaccination strategy when the rate of antigenic drift ω is fixed at 0.5 year−1. (c) The equilibrium Sk/N distribution under these three strategies. The solid bold line shows the distribution in the absence of a vaccination policy, the dotted line shows the distribution under the paediatric vaccination policy, and the line with circle marks shows the distribution under the random vaccination policy. (d) The equilibrium mean binding avidity under these three strategies. Parameter values used are as in figure 2. Vaccination rates, in units of year−1, under the paediatric vaccination strategy are given by pk = m(1−s)ks, with m = 2 and s = 0.8, resulting in vaccination rates that decrease with an increase in the number of previous exposures k. The vaccination rate, also in units of year−1, under the random vaccination strategy is p = 0.037. These vaccination rates lead to the same total number of vaccinations delivered per unit time, with approximately 4% of the population vaccinated annually. The total number of vaccinations delivered was kept constant across the two vaccination strategies by first calculating the total number of individuals vaccinated per unit time for the paediatric vaccination strategy. This is given by  In the random vaccination scenario, the total number of individuals vaccinated per unit time is pN, where p is the vaccination rate that is independent of the number of previous exposures. In our simulations, we therefore chose p by dividing the total number of individuals vaccinated per unit time in the paediatric vaccination scenario by the population size N.

