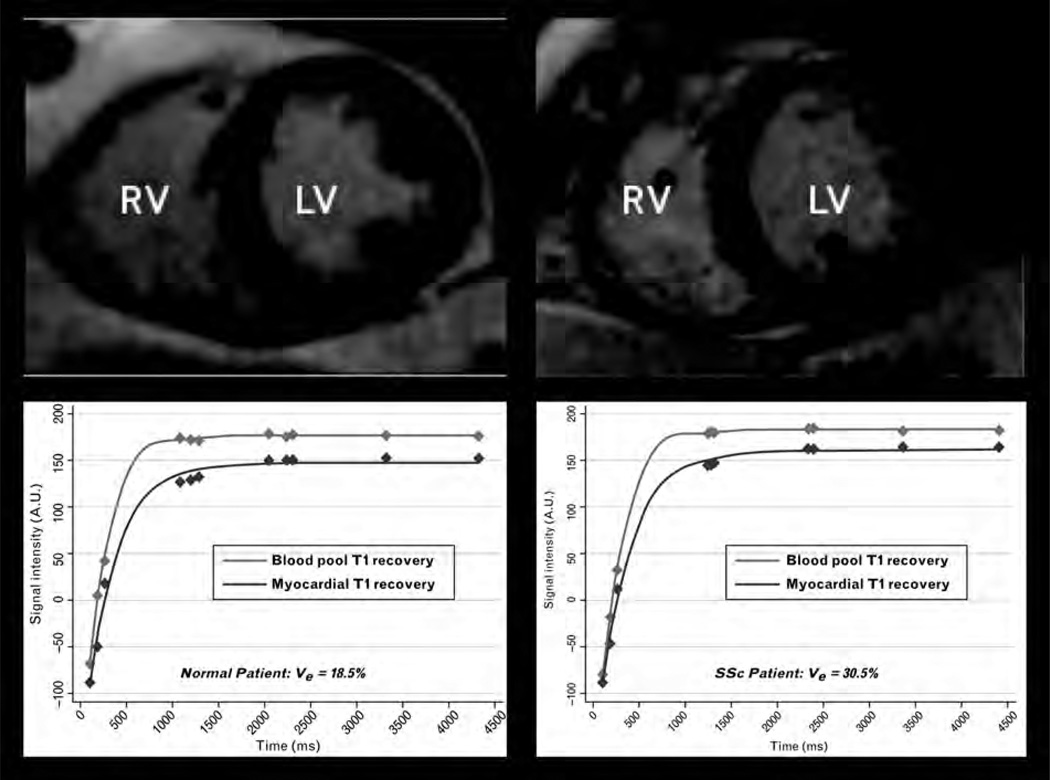
Figure 2. Diffuse myocardial fibrosis quantification by cardiac magnetic resonance.
Late gadolinium enhanced (LGE), mid-left ventricular short axis images and corresponding postcontrast T1 mapping of the blood pool and myocardium in a normal control (left panel) and a patient with diffuse cutaneous SSc (right panel). Although LGE images demonstrate no focal areas of myocardial fibrosis, postcontrast myocardial T1 mapping demonstrates faster recovery (shorter T1) in the SSc patient. Precontrast and postcontrast T1 values in the blood and myocardium are used to calculate the extracellular volume fraction (Ve). In the example shown, there is substantially greater diffuse myocardial fibrosis (higher Ve) in the SSc patient compared with normal despite similar appearance of the left ventricle.

