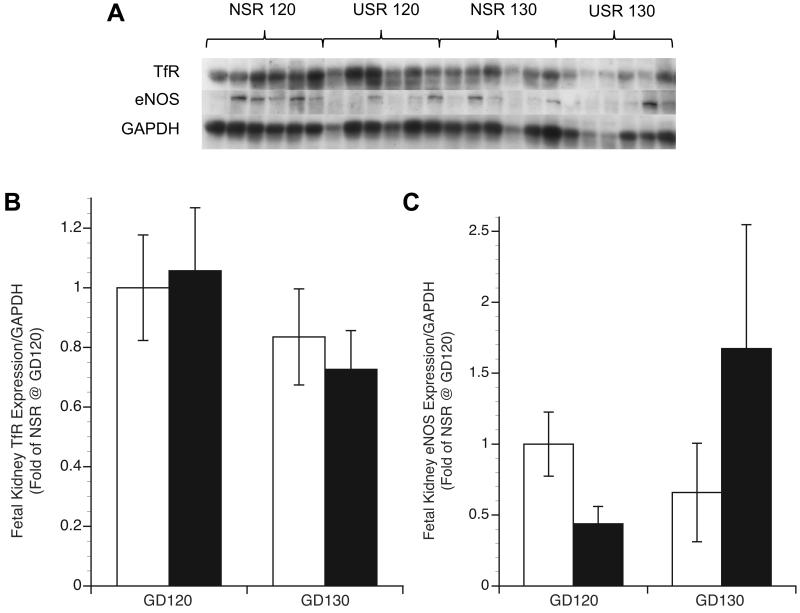
Figure 2.
Fetal kidney TfR and eNOS expression in nonrestricted (NSR) and space-restricted (USR) groups at GD120 and GD130. A) Western blot of TfR and eNOS with GAPDH as loading control in fetal kidney. B and C) Respective optical density means (fold of control NSR at GD120) and SEM. White bars: NSR, black bars: USR. *Significant difference (P<0.05) compared to NSR at GD120. **Significant difference (P<0.05) compared to USR at GD120. †Significant difference (P<0.05) compared to NSR at GD130.

