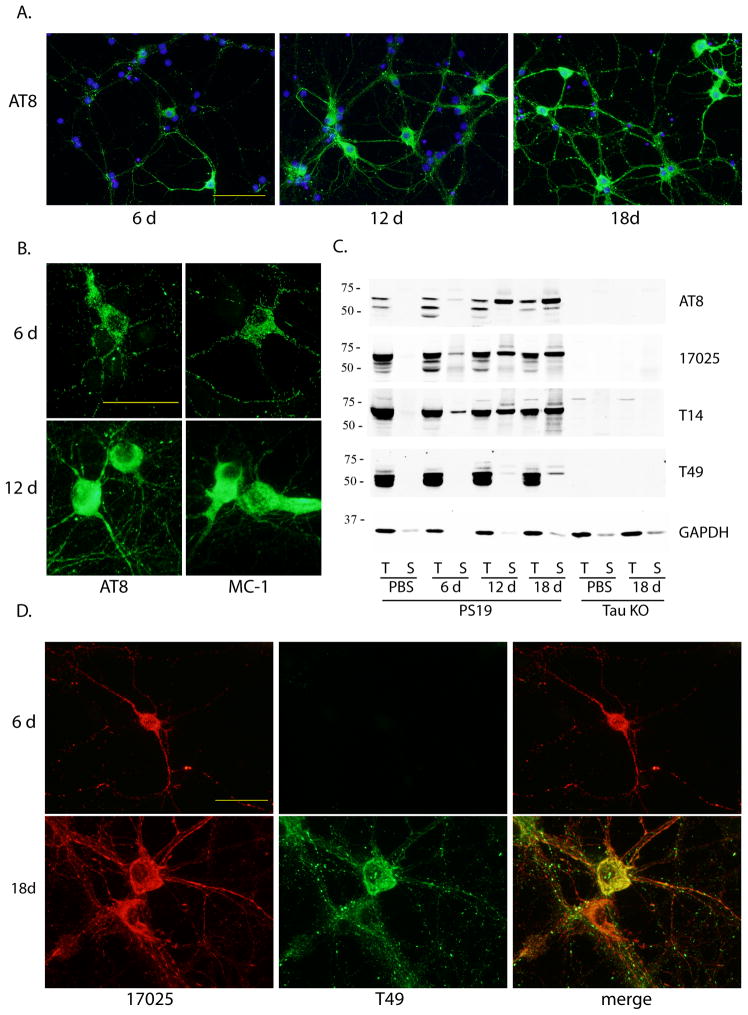
Figure 3. Time-dependent increase in pff-induced tau pathology and recruitment of mouse tau into aggregates.
(A) Increasing population of cells developed tau pathology from 6 d to 18 d incubation after pff addition. Green: AT8. Blue: DAPI. Scale bar: 100 μm. (B) Morphological difference between 6 d and 12 d post-transduction aggregates immunostained with AT8 and MC-1. Scale bar: 50 μm. (C) Sequentially extracted PS19 neuron lysates at different time points after pff addition (6 d, 12 d, 18 d) or at 18 d after PBS treatment (PBS) and tau knock-out neuron lysates (tau KO) at 18 d post-addition of PBS or pffs were immunoblotted with AT8, 17025, T14 as well as mAb specific for mouse tau (T49). (D) Double-labeling of aggregates by T49 and 17025 at different time points after pff addition. Scale bar: 50 μm. For (A), (B) and (D), soluble proteins were removed by 1% Triton-X100 during fixing.

