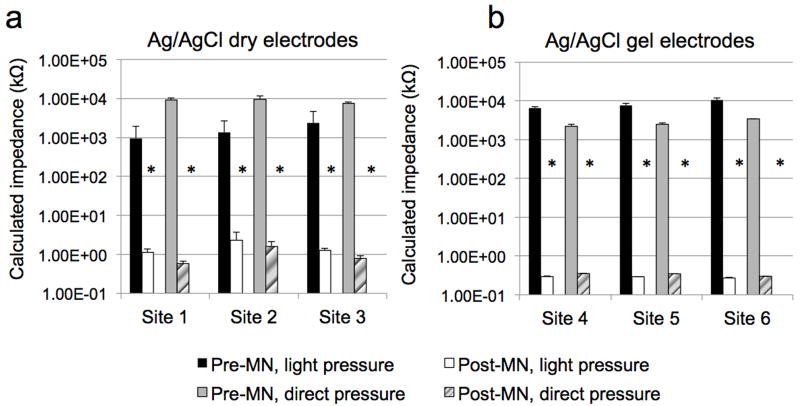
Figure 3. Representative impedance profiles at six treatment sites on one human subject; all measurements were made on the hairless upper arm following an overnight pre-hydration period.
Each bar represents the mean ± SD (error bars) of 3 measurements. a: measurements made at 3 independent with dry Ag/AgCl electrodes. b: measurements made at 3 independent with gel Ag/AgCl electrodes. Mean (± SD) %RSD with gel electrodes under direct application for pre-MN was 7.8 ± 6.5% (range 0.8 – 13.6%), whereas there was no deviation between repeated measurements under post-MN conditions (at each site, the 3 measurements were identical). Under the same conditions (direct pressure) for the dry electrodes, the mean %RSD pre-MN was 14.6 ± 8.9% (range 6.8 – 24.3%) and 23.0 ± 9.2% (range 17.6 – 33.7%) for post-MN.

