
Figure 2.
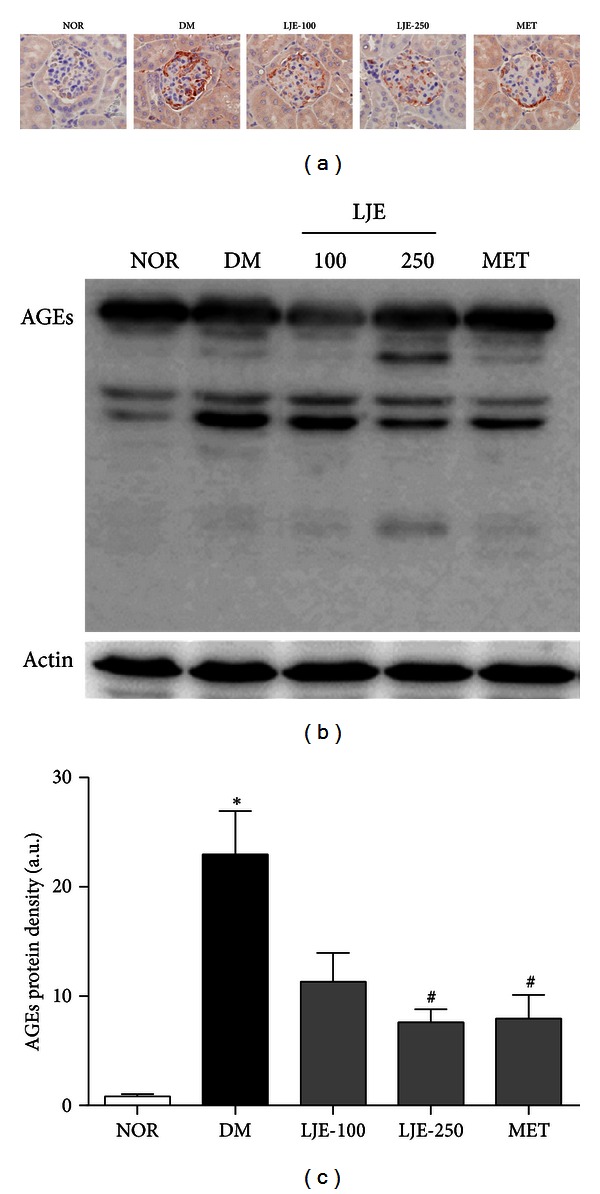
Effect of LJE on AGE accumulation in the renal glomeruli. (a) Immunohistochemical staining of AGEs. ×400 magnification. (b) AGE protein expression in each group. (c) Quantitative analysis of the AGE signals in histological sections. All data are expressed as the mean ± SEM (n = 8). *P < 0.01 versus the NOR group, # P < 0.01 versus the DM group.