
Figure 3.
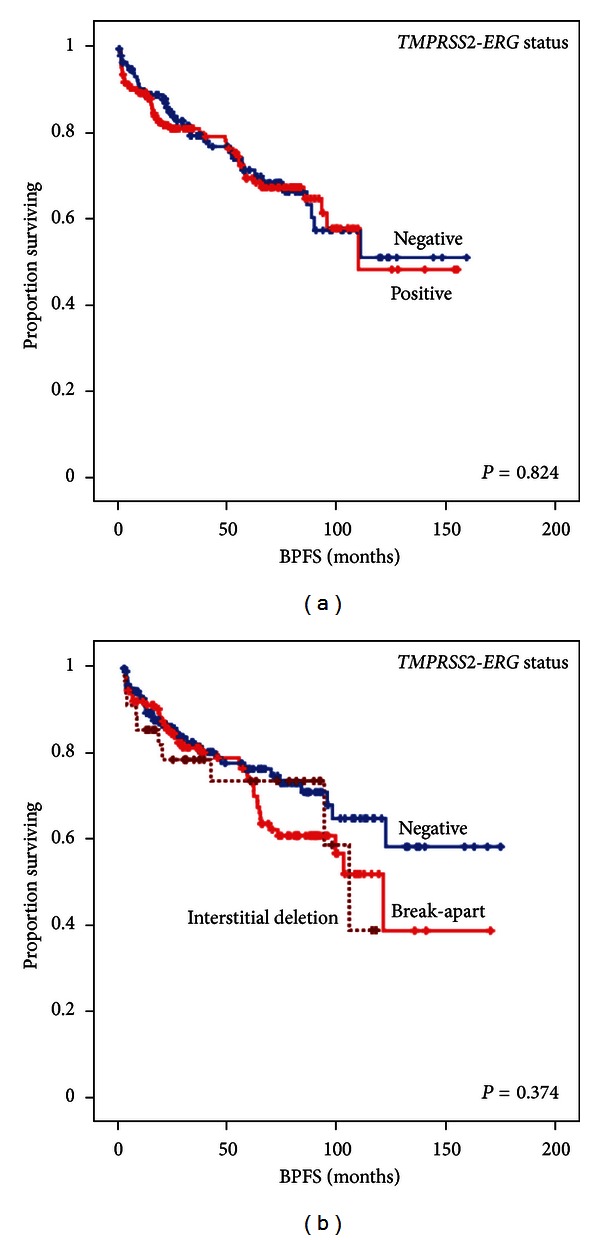
Kaplan-Meier plots of the univariate survival analysis. (a) Biochemical progression free survival (BPFS) according to the TMPRSS2-ERG status measured by FISH and/or RT-PCR. (b) BPFS according to the mechanism of the rearrangement determined by tricolor FISH assay.