
Figure 2.
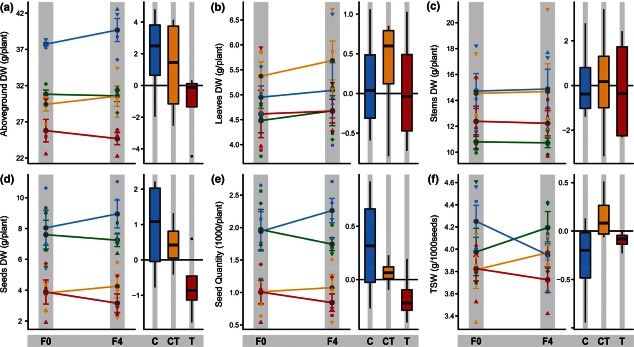
Mean values (±standard error) of biomasses fractions at final harvest determined for the four replicate selection linages of Brassica napus grown in a phytotron environment at the four possible combinations of two temperatures and [CO2] regimes (Table 1) in two generations: (a) aboveground DW, (b) Leaves DW, (c) Stems DW, (d) Seeds DW, (e) Seed Quantity, (f) thousand seed weight (TSW) F0 – ancestral stock population, F4 – fourth descendant population selected in the corresponding environments – gray-filled, round symbols connected by a line. Treatments: green – Ctrl (control), blue – elevated [CO2] (C), red – increased temperatures (T), orange – elevated [CO2] and increased temperatures (CT). Point characters of the same shape represent RSLs with the same identity. Boxplots show the difference in slopes between the trans-generational response in the given treatments and the control scenario for the four RSL: (trait value meanF4 – trait value mean F0)C, CT, T – (trait value meanF4 – trait value mean F0)Ctrl, DW, dry weight; TSW, thousand seed weight.