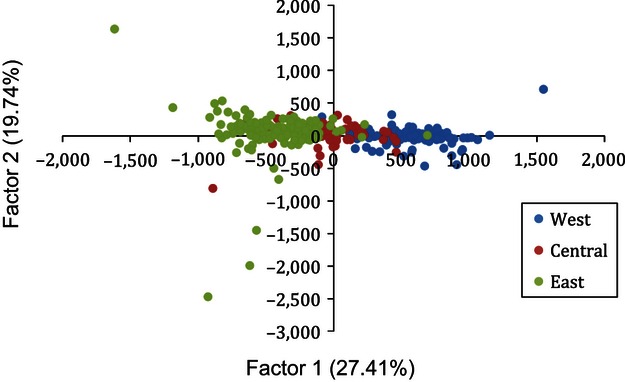
Figure 3.

Two-dimensional scatter plot showing the relationships among Donax deltoides sample locales based on a factorial correspondence analysis of nine microsatellite loci for 11 sites. The first factor (x axis) explains 27.41% of the variance, whilst the second factor (y axis) explains 19.74%.
