Figure 6.

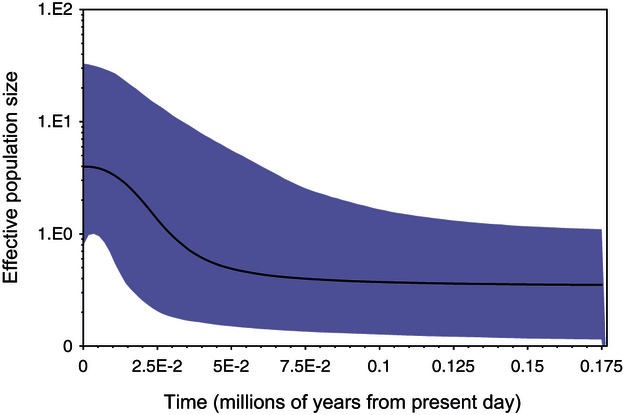
Bayesian skyline plot showing demographic history of Donax deltoides. The thick solid line is the median estimate while the shaded area overlay represents the 95% highest posterior density limits.

Bayesian skyline plot showing demographic history of Donax deltoides. The thick solid line is the median estimate while the shaded area overlay represents the 95% highest posterior density limits.