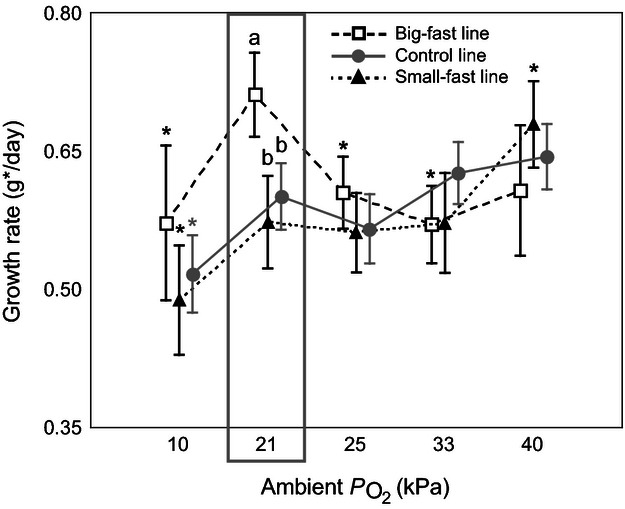
Figure 2.

Effects of varying oxygen levels on growth rate. In this and Figures 5, asterisks indicate within-line differences from normoxia (21 kPa po2, as indicated by the gray rectangle), determined by a priori planned comparison tests. Letters indicate significant differences among the lines in normoxia, tested with Tukey post hoc test. Vertical bars denote 95% confidence intervals.
