
Figure 2.
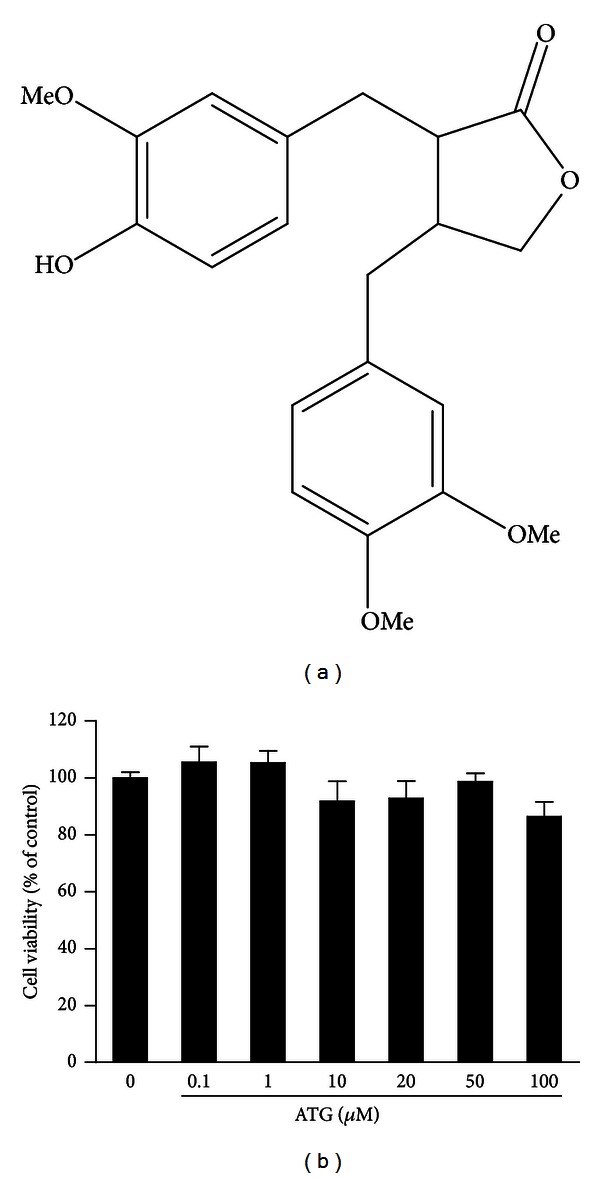
Chemical structure (a) and cytotoxicity of ATG at different treatment doses (b). Values of cytotoxicity were represented as a percentage (%) of control, with mean ± SD of three independent experiments.
Official websites use .gov
A
.gov website belongs to an official
government organization in the United States.
Secure .gov websites use HTTPS
A lock (
) or https:// means you've safely
connected to the .gov website. Share sensitive
information only on official, secure websites.
Chemical structure (a) and cytotoxicity of ATG at different treatment doses (b). Values of cytotoxicity were represented as a percentage (%) of control, with mean ± SD of three independent experiments.