
Figure 3.
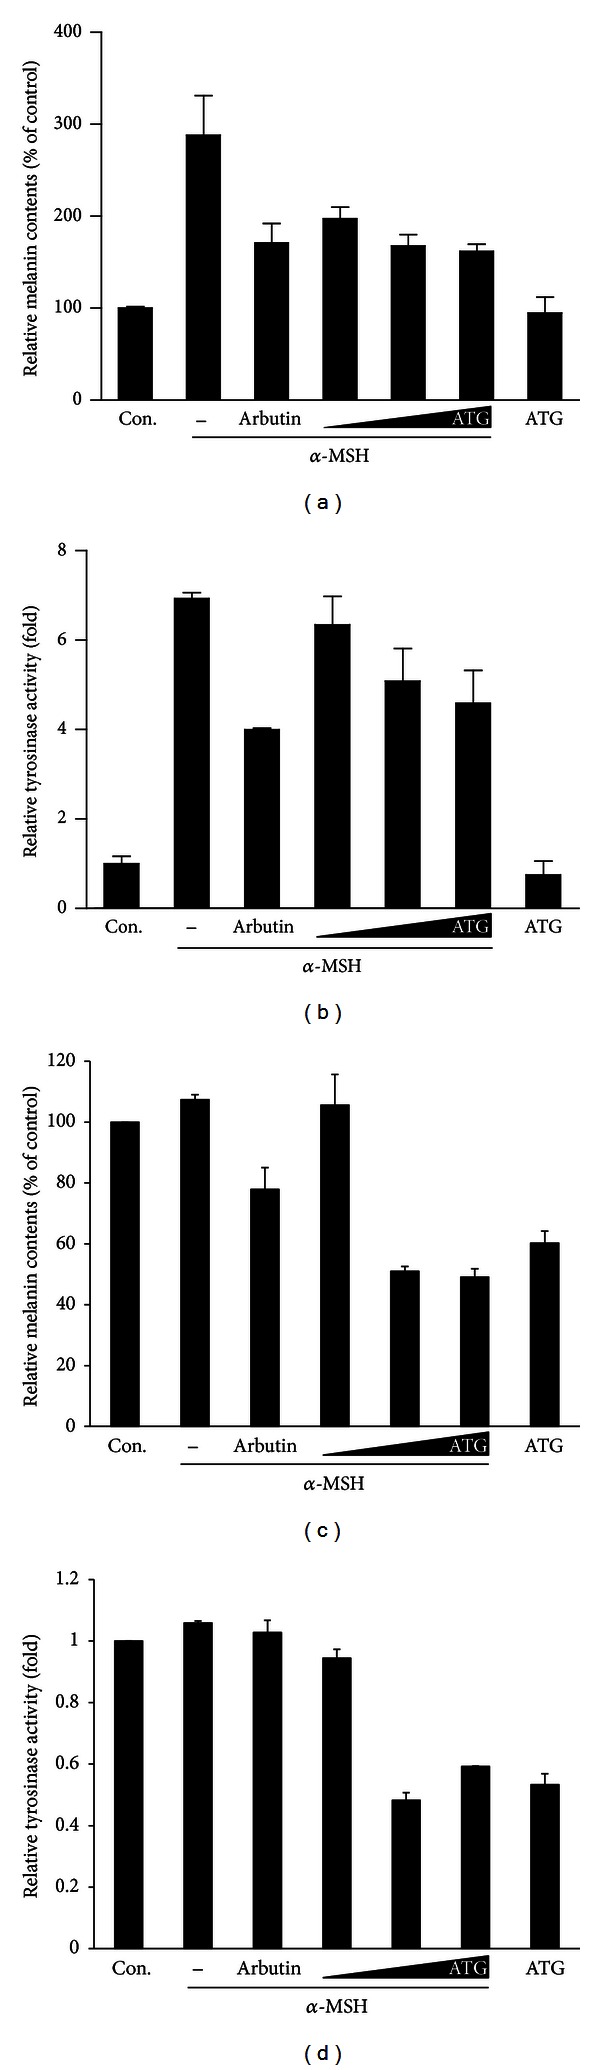
Effect of ATG (1, 10, and 50 μM) on α-MSH (100 nM) stimulated murine B16BL6 melanoma cells ((a) and (b)) and melan-A cells ((c) and (d)). Data are represented as relative melanin contents and tyrosinase activity compared with arbutin (100 μg/mL). ATG concentration without α-MSH was 10 μM. All values were represented from three independent experiments with mean ± SD values.