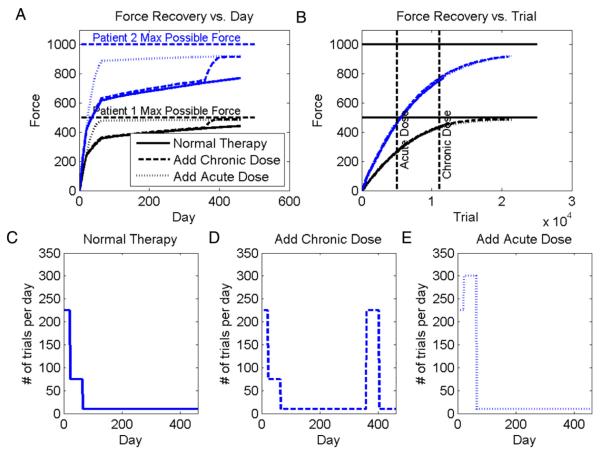
Fig. 3.
Residual capacity predicted by model. A: force recovery versus day for two simulated patients with 1000 and 2000 residual CS neurons, respectively, with σ = 0.04. The plot shows temporal recovery curves predicted for three different exercise protocols, which are defined in the bottom row of graphs. Adding an additional dose of therapy increased strength recovery, consistent with the clinical finding of residual capacity. B: force recovery versus movement repetition trial for the same two simulated patients. Bottom row: The simulations use an estimated number of movement repetitions per day. C: for the standard protocol, in the acute phase (first 21 days after the stroke), the patient exercises frequently, in the sub-acute phase (the next 42 days after the stroke) less, and in the chronic phase less. D: for the chronic-enhanced protocol, the patients receive an extra dose of movement training in the chronic phase following a stroke. E: for the acute-enhanced protocol, the patients received an extra dose of movement training in the sub-acute phase following a stroke. The number of estimated movement repetitions per day approximate research rehabilitation exercise protocols presented in the literature. The number of repetitions is small in the chronic phase, because we assumed the impaired wrist was difficult for the patient to use effectively, that formal therapy was discontinued, and that the patient preserved a “good” hand that he could instead use to achieve desired daily function, limiting the use of the impaired hand. The simulation results were robust to the specific numbers of repetitions used, unless very few or very many movements were used, in which case the interesting, residual-capacity effects became decreasingly small. The simulation results were also robust to changes in network parameters such as number of cells, amount of noise, or optimization algorithm (local or gradient search).

