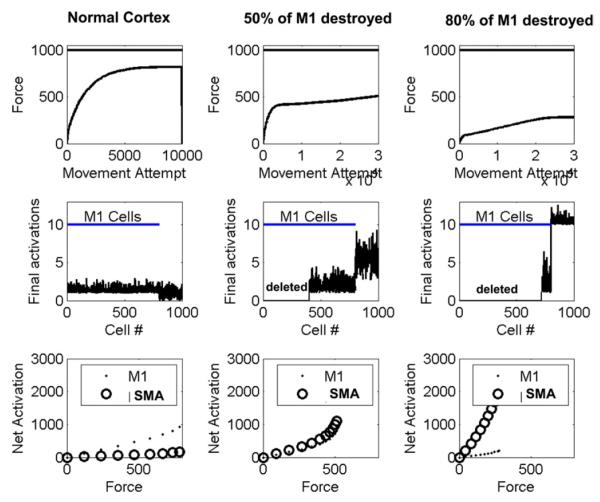
Fig. 4.
Spread of activation into secondary motor area following a stroke in the primary motor cortex. First column: the recovery dynamics for a “normal” cortex with 800 agonist-related cells in M1 (cells 1–800 in the middle row), and 200 in a secondary area, assumed to be supplementary motor area (SMA, cells 801–1000 in the middle row). The cells in SMA had 10% of the connection strength of the M1 cells. The top graph in the first column shows learned force as a function of movement attempt; the solid horizontal line shows the maximum force the network is capable of achieving. The middle graph in the first column shows the cell activities following 10 000 movement attempts; the SMA cells (cells 800–1000) remain poorly optimized due to their weaker connections. The bottom graph in the first column shows the net activation of the cells, which estimates the fMRI BOLD signal, as a function of force. In the normal cortex, the net activation was greater for M1, and showed greater force-dependence for M1 (first column, third row). The second column shows the recovery process after 50% of the M1 cells of the optimized healthy cortex were destroyed. There was an increase in force-related SMA activity following optimization (second column, bottom row). The third column shows the recovery process after 80% of the cells of the optimized healthy cortex were destroyed. There was a further increase in force-related SMA activity (third column, bottom row). For these plots, σ = 0.02.

