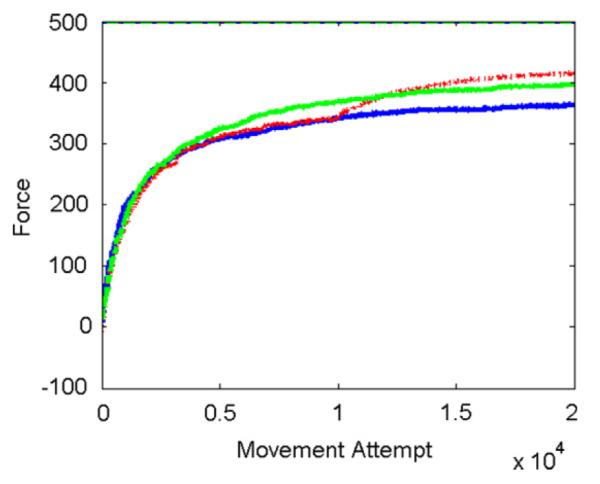
Fig. 5.

Effect of changing noise amplitude on force recovery. The three curves show learning with a fixed noise level (blue, normally-distributed noise with standard deviation σ = 0.04), learning in which noise amplitude was decreased at movement attempt 10 000 (red, σ = 0.04 until trial 10 000, and 0.01 after), and learning with signal-dependent noise (green, σ = 0.03 + 0.02x, where x is activation of CS cell). Network of 1000 cells optimized with best-first search. (For interpretation of the references to colour in this figure legend, the reader is referred to the web version of this article.)
