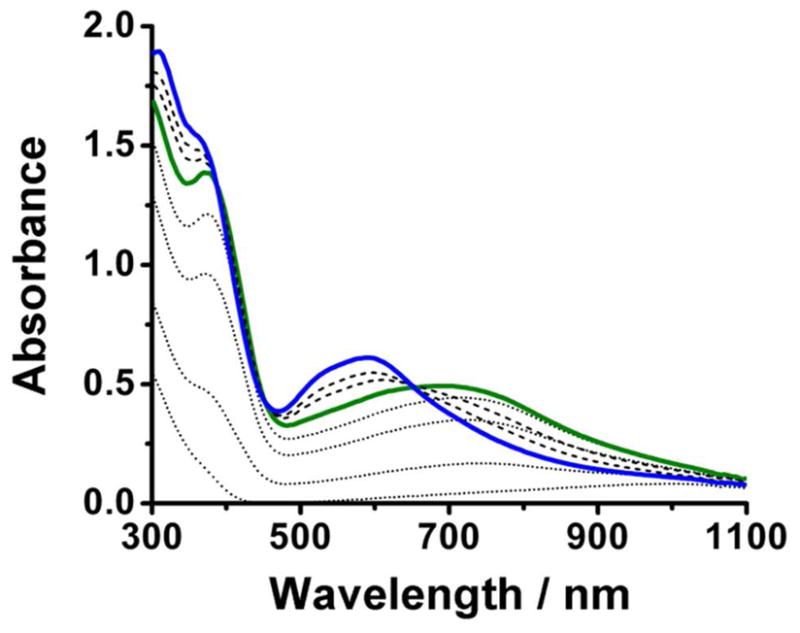
Figure 3.

Selected UV-Vis spectra obtained in the reaction of O2 and 1•O2CCPh3 in CH2Cl2 at −90° showing initial formation of 2•O2CCPh3 (solid green line) and subsequent conversion to 3•O2CCPh3 (solid blue line). Dotted lines correspond to spectra leading to the appearance of 2•O2CCPh3 within the first 40 seconds, while dashed lines correspond to spectra associated with the conversion of 2•O2CCPh3 to 3•O2CCPh3 over the course of the following hour.
