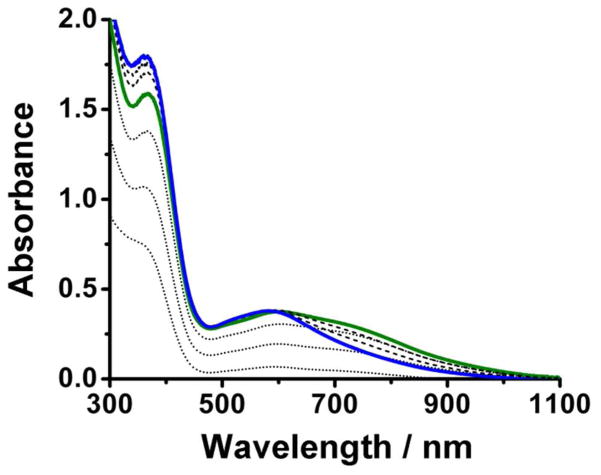
Figure 6.
Selected UV-Vis spectra obtained in the reaction of O2 with 1•O2CPh at −90° showing evidence for the formation of two peroxo intermediates. The solid green line represents the spectrum with the largest fraction of 2•O2CPh formed, while the solid blue line corresponds to the subsequently formed 3•O2CPh. Dotted lines correspond to spectra leading to the maximum amount of 2•O2CPh formed within the first 90 seconds after oxygenation, while dashed lines correspond to spectra associated with the conversion of 2•O2CPh to 3•O2CPh over the course of the following 30 minutes.

