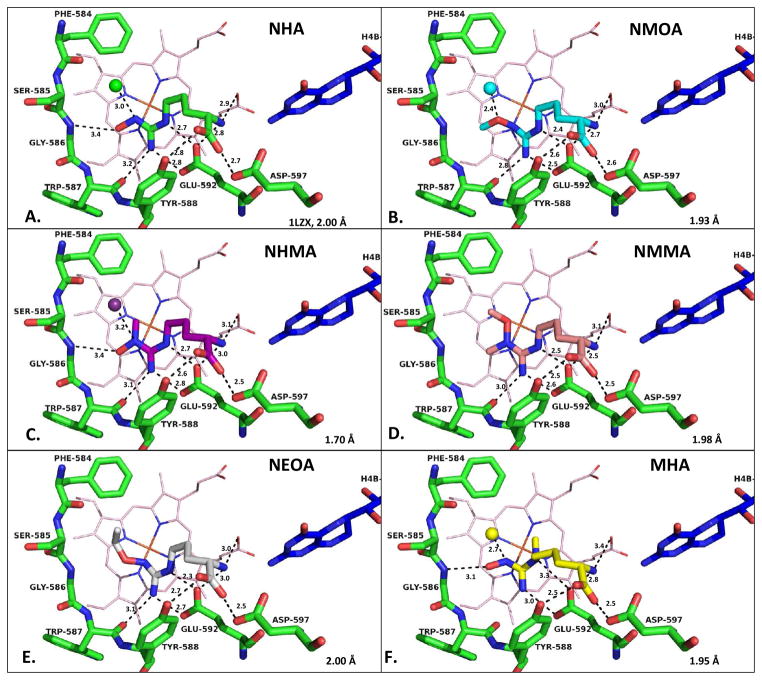
Figure 3.
Crystal structures of analogues complexed with nNOS. Heme is shown in light pink and H4B in dark blue; nNOS active site residues are in green; active site water is shown as a sphere. (A) NHA (green, PDB 1LZX) (B) NMOA (cyan) which was modeled with the methyl group in two alternate positions but with only major one shown. (C) NHMA (magenta) (D) NMMA (peach) (E) NEOA (grey) (F) MHA (yellow), which showed poorer density quality indicating partial disordering. Hydrogen bonding interactions are depicted by black dashed lines; distances are reported in Å. See Figure S12 for crystal structure of tBOA.

