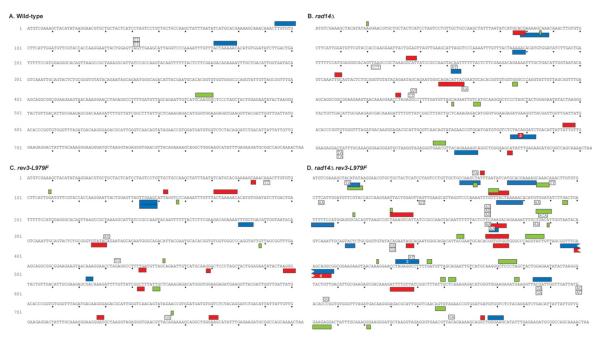
Fig. 3.
Spectra of clustered and TBPS mutations observed in wild-type, rev3-L979F, rad14Δ, and rad14Δ rev3-L979F strains. The sequence of the URA3 coding sequence is shown in black text with dots marking every 10 bases. Mutations from the URA3 Orientation 1 strain are shown above the URA3 reference sequence and mutations from the isogenic URA3 Orientation 2 strain are shown below. Boxed letters indicate TBPS with the mutant sequence indicated within the box. Filled boxes indicate clustered mutations with the length of the box extending from the first to the last mutated base in the mutation cluster. Blue boxes indicate cbps, clustered mutations composed of only base substitutions; green boxes indicate clustered mutations that include ≥1 insertions; and red boxes indicate clustered mutations that include ≥1 deletions. A white number within a box indicates the number of identical clustered mutations observed. Mutation spectra for the entire URA3 ORF and the sequences of clustered mutations are shown in the Supporting Information.

