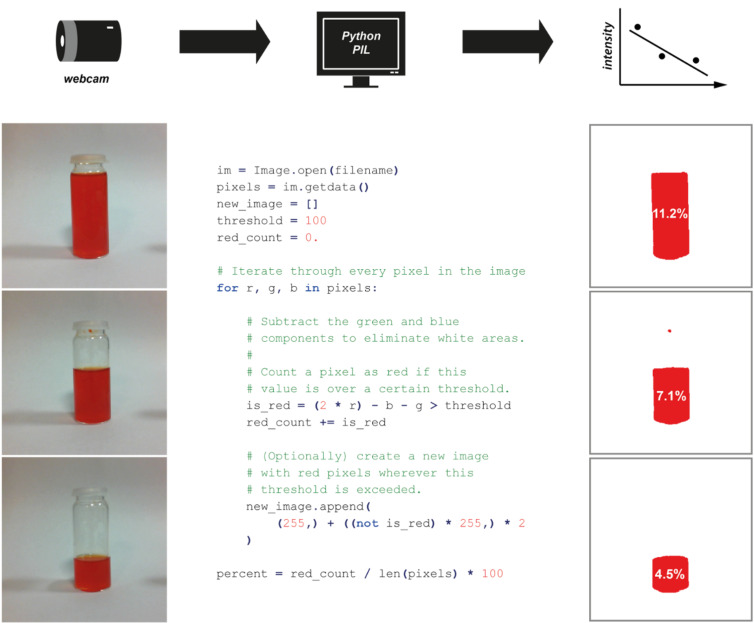
Figure 15.
Use of the Python Imaging Library to analyse the proportion of an image consisting of red pixels. An image is read into the program from a saved file (reading from a USB or networked camera is also possible) and separated into its constituent pixels, whose component colours are then analysed to identify those that are predominantly red in colour. The percentage area of the image that is red is then calculated as the proportion of pixels that surpass a threshold. In an 8-bit image each colour component is encoded as an integer from 0 to 255, and so the threshold of 100 here corresponds to approximately 40% red character. This is sufficient to pick out the region corresponding to the red liquid in the images.

